



Abstract
Purpose:
There is a growing need for noninvasive biomarkers to guide individualized spatiotemporal delivery of radiation therapy (RT) and antiangiogenic (AA) therapy for brain tumors. This study explored early biomarkers of response to RT and the AA agent sunitinib (SU), in a murine intracranial glioma model, using serial magnetic resonance imaging (MRI).
Methods and Materials:
Mice with MRI-visible tumors were stratified by tumor size into 4 therapy arms: control, RT, SU, and SU plus RT (SURT). Single-fraction conformal RT was delivered using MRI and on-line cone beam computed tomography (CT) guidance. Serial MR images (T2-weighted, diffusion, dynamic contrast-enhanced and gadolinium-enhanced T1-weighted scans) were acquired biweekly to evaluate tumor volume, apparent diffusion coefficient (ADC), and tumor perfusion and permeability responses (Ktrans, Kep).
Results:
Mice in all treatment arms survived longer than those in control, with a median survival of 35 days for SURT (P<.0001) and 30 days for RT (P=.009) and SU (P=.01) mice vs 26 days for control mice. At Day 3, ADC rise was greater with RT than without (P=.002). Sunitinib treatment reduced tumor perfusion/permeability values with mean Ktrans reduction of 27.6% for SU (P=.04) and 26.3% for SURT (P=.04) mice and mean Kep reduction of 38.1% for SU (P=.01) and 27.3% for SURT (P=.02) mice. The magnitude of individual mouse ADC responses at Days 3 and 7 correlated with subsequent tumor growth rate R values of −0.878 (P=.002) and −0.80 (P=.01), respectively.
Conclusions:
Early quantitative changes in diffusion and perfusion MRI measures reflect treatment responses soon after starting therapy and thereby raise the potential for these imaging biomarkers to guide adaptive and potentially individualized therapy approaches in the future.
Summary
This study investigated the ability of serial magnetic resonance imaging (MRI) to evaluate the effects of sunitinib (SU) antiangiogenic therapy and conformal radiation (RT) in an orthotopic brain tumor model and to identify promising noninvasive biomarkers of early treatment response. MRI biomarker responses included greater rises in tumor diffusion with RT and greater reductions in tumor perfusion/permeability (Ktrans) with SU. Early individual tumor diffusion response predicted for subsequent tumor growth rate.
Introduction
There is a growing need for noninvasive biomarkers that can guide the spatiotemporal prescription of combination treatment with antiangiogenic agents (AA) and radiation therapy (RT). Thus far, attempts to combine AA with RT have resulted in mixed responses, potentially reflecting various schedules of combining AA and RT with limited biological rationale for the sequence and timing of treatments (1–3). Establishing early, noninvasive, reproducible, quantitative biomarkers that reflect tumor physiological responses may facilitate a more rational approach for combining AA and RT and may ultimately enable individualized, adaptive treatment approaches.
Magnetic resonance imaging (MRI) plays a major role in the current management of brain tumors, providing information for diagnosis, image guidance for local treatment, and response assessment following treatment. MRI presents the potential for a single imaging modality to evaluate multiple tumor parameters including tumor morphology, peritumoral edema, cellular density, and vascular perfusion (Ktrans) and permeability (Kep). Rises in tumor apparent diffusion coefficient (ADC) in response to cytotoxic therapy have been detected prior to any tumor volume changes in gliomas, likely reflecting reduced tumor cellularity (4, 5). Measures of tumor vascular response, such as changes in initial area under the curve at 60 seconds, Ktrans and/or Kep, following antiangiogenic and RT have been observed prior to changes in tumor volume in preclinical subcutaneous solid tumor models, including glioma tumors (6, 7). Quantitative longitudinal MRI measures of tumor volume and vascular and ADC responses would provide a comprehensive evaluation of tumor response over time to antiangiogenic and radiation therapies.
The purpose of this study was to evaluate murine intracranial tumor response to RT and the antiangiogenic drug sunitinib (SU), using serial multiparametric MRI evaluation. Sunitinib is an oral tyrosine kinase receptor inhibitor that acts at VEGF receptors 1 and 2, PDGF receptor, stem cell factor receptor (c-KIT), FLT3, and RET kinases (8). Because frequent serial MRI studies and correlative pathology are often difficult to acquire in patients, this study demonstrates how preclinical experimentation can assist in the discovery and translation of promising biomarkers for subsequent clinical investigation.
Methods and Materials
Cell culture
Human glioblastoma (GBM) cell line U87 (American Type Culture Collection) cells were grown in Dulbecco modified Eagle medium and 10% fetal bovine serum under standard conditions (37°C in 5% CO2 and 95% room air).
Mouse intracranial model
U87 GBM (2 × 10⁵) cells in 10 μl of PBS were injected stereo-tactically into the right frontal lobe (1 mm anterior, 2 mm lateral to the bregma at a 3-mm depth from the dura) of 6-week-old nonobese diabetic/severe combined immunodeficiency (NOD/SCID) mice. All animal care conditions and studies were approved and carried out in accordance with protocols approved under the guidelines of the Canadian Council on Animal Care.
Antiangiogenic and radiation treatments
The presence of gross tumor was confirmed on baseline MRI at Day 7 postintracranial (post-IC) injection. Sunitinib (SU) and RT were started on Day 8 post-IC injection (Fig. 1). Sunitinib (Pfizer), 40 mg/kg/day (9) dissolved in carboxymethylcellulose or placebo carboxymethylcellulose was administered by oral gavage for 7 days, with the weekend off. Radiation was delivered using a cone beam CT (CBCT) image-guided small animal irradiator (product code, XRad225Cx; Precision X-Ray, Inc) (Fig. 2b). Mice under isoflurane anesthesia were positioned in a custom-built immobilization device with MRI-compatible bite block and ear pins.
Fig. 1.

Timeline of the treatments and MRI imaging sessions. MRI on Day 0 confirmed and measured baseline tumor volume. Sunitinib (SU) was delivered for 7 weekdays. Radiation (RT) 8 Gy in 1 fraction was delivered on Day 1 of treatment, after the first dose of SU. Multiparametric MRI was on Days 3, 7, 10, 14, and 21.
Fig. 2.

(a) Representative intracranial tumors at baseline showing the variability in size and location. (b) Representative images of the radiation plan: (i) axial coregistered baseline T1-weighted gadolinium-enhanced MRI and treatment day CBCT; (ii) axial CBCT image with radiation isodoses (10% orange, 90% red, 95% teal), around the tumor and the isocenter at the center of the 2 axes, placed using visual estimation of the tumor location using baseline MRI.
Radiation (225 kVp) was delivered with anterior-posterior parallel opposed beams, using a 0.5-cm collimator, and using information from the baseline MR and CBCT images to guide isocenter placement (Fig. 2b). A single fraction of 8 Gy was prescribed to a 5-mm depth from the dorsum of the skull. All mice, including those that were not irradiated, were anesthetized and imaged with CBCT to expose all mice to similar anesthesia and radiation treatment setup conditions.
Follow-up and longitudinal MRI acquisition and analysis
Mice were followed with biweekly MRI and urine collection. A subset of mice was followed for survival analysis, and these mice were sacrificed when they showed advanced neurological deficit, seizures, or failure to thrive. Remaining mice were sacrificed at prespecified time points to investigate the pathological features associated with the MRI findings.
MRI
A 7-T Bruker model BioSpec 70/30 MR system with B-GA12 gradient coil, 7.2-cm-diameter linear radiofrequency (RF) transmitter coil, murine head RF receiver coil, and murine slider bed was used for serial imaging. Mice under isoflurane anesthesia were positioned on the MR bed with a bite block and water warming system to maintain body temperature at 38°C during imaging. Breathing rate was monitored using a pneumatic pillow (P-resp; Small Animal Instruments, Inc), and isoflurane was adjusted to maintain a rate of 35–45 breaths per minute (~1.8%). A detailed description of the serial multiparametric MRI protocol is provided in the supplementary material.
Image analysis
Image processing and manual segmentation of regions of interest (ROIs) were supported by MIPAV software (National Institutes of Health). Tumor ROIs were manually delineated on postcontrast T1-weighted gadolinium-enhanced images, as the integrated region of signal enhancement and these ROIs were transposed to corresponding dynamic contrast-enhanced (DCE) ADC maps and quantitative T1 (qT1) image sets at each time point. For diffusion analysis, the tumor ROI was also copied to similar regions of contralateral normal brain. For both tumor and contralateral ROIs, voxels clearly including ventricles were excluded prior to extracting the mean ADC and standard deviations. For DCE analysis, the basilar artery was manually segmented on a late-time contrast-enhanced DCE image for extraction of arterial input function (AIF) data. Both the tumor ROI and the AIF contours were transposed across all time points for extraction of signal intensity data (Fig. 5a) (10). We used DCE Tool version 1.04 software (www.TheDCETool.ca; University Health Network/Ontario Institute for Cancer Research) to calculate Ktrans and Kep by using the modified Tofts model analysis, applying a hematocrit value of 0.34, a relaxivity value of 3.9, and individual mouse AIF and T1 input values.
Fig. 5.

(a) Mean percent change in Ktrans from baseline showing a significant decrease in both SU arms at Day 3 (SU, P=.04; SURT, P=.04) and a sustained drop in Ktrans in the SURT arm. (b) Mean percent change in Kep showing a significant decrease in both SU arms at Day 3 (SU, P=.01; SURT, P=.02). (c) Mean percent change in precontrast tumor T1 from baseline. (d) Mean percent change in Ktrans when population T1 and individual mouse T1 are used in the modified Tofts model for each treatment arm showing less variability with individual T1.
Urine biomarkers
NOD/SCID mouse urine samples were collected at baseline and biweekly under sterile conditions and then frozen at −20°C immediately after collection. For each treatment group, a 125-μL aliquot of urine was analyzed at each time point, using Human Angiogenesis Antibody Array (R&D Systems) according to the manufacturer’s protocol.
Statistical analysis
Log-rank statistics were used for survival analysis, and mixed effect modeling was used to calculate tumor doubling time and to compare tumor growth rate between arms. Student paired t-test was used for significance testing of changes in DCE metrics and ADC from baseline, and analysis of variance was used to make comparisons between treatment arms, using a P level of <.05 for both.
Results
Tumor volume, growth rate, and survival
Nine of 57 mice had no visible tumors on baseline MRI on Day 7 post-IC injection. These mice were excluded from further analysis. The remaining 48 mice were stratified to treatment arms such that mean tumor volumes for all arms were similar (0.84–1.17 mm3, P=.16), although tumor volumes ranged from 0.16–2.60 mm3 and varied slightly in location within the brain. Thirty-six mice (9 in each treatment arm) were followed for survival, of which 4 mice in each arm were also followed with serial imaging for longitudinal tumor growth measures. The remaining 12 mice were serially imaged and sacrificed at prespecified time points for correlation with pathology. Survival was longer in all treatment arms compared to that in placebo, with the longest survival in the SU plus RT (SURT) arm (P<.0001), followed by the RT arm (P=.009), and then the SU arm (P=.01) arm. (Fig. 3a) Survival for SURT mice was longer than that of mice that received SU alone (P=.02) or RT alone (P=.05). One early death occurred immediately after oral gavage in the SU arm.
Fig. 3.
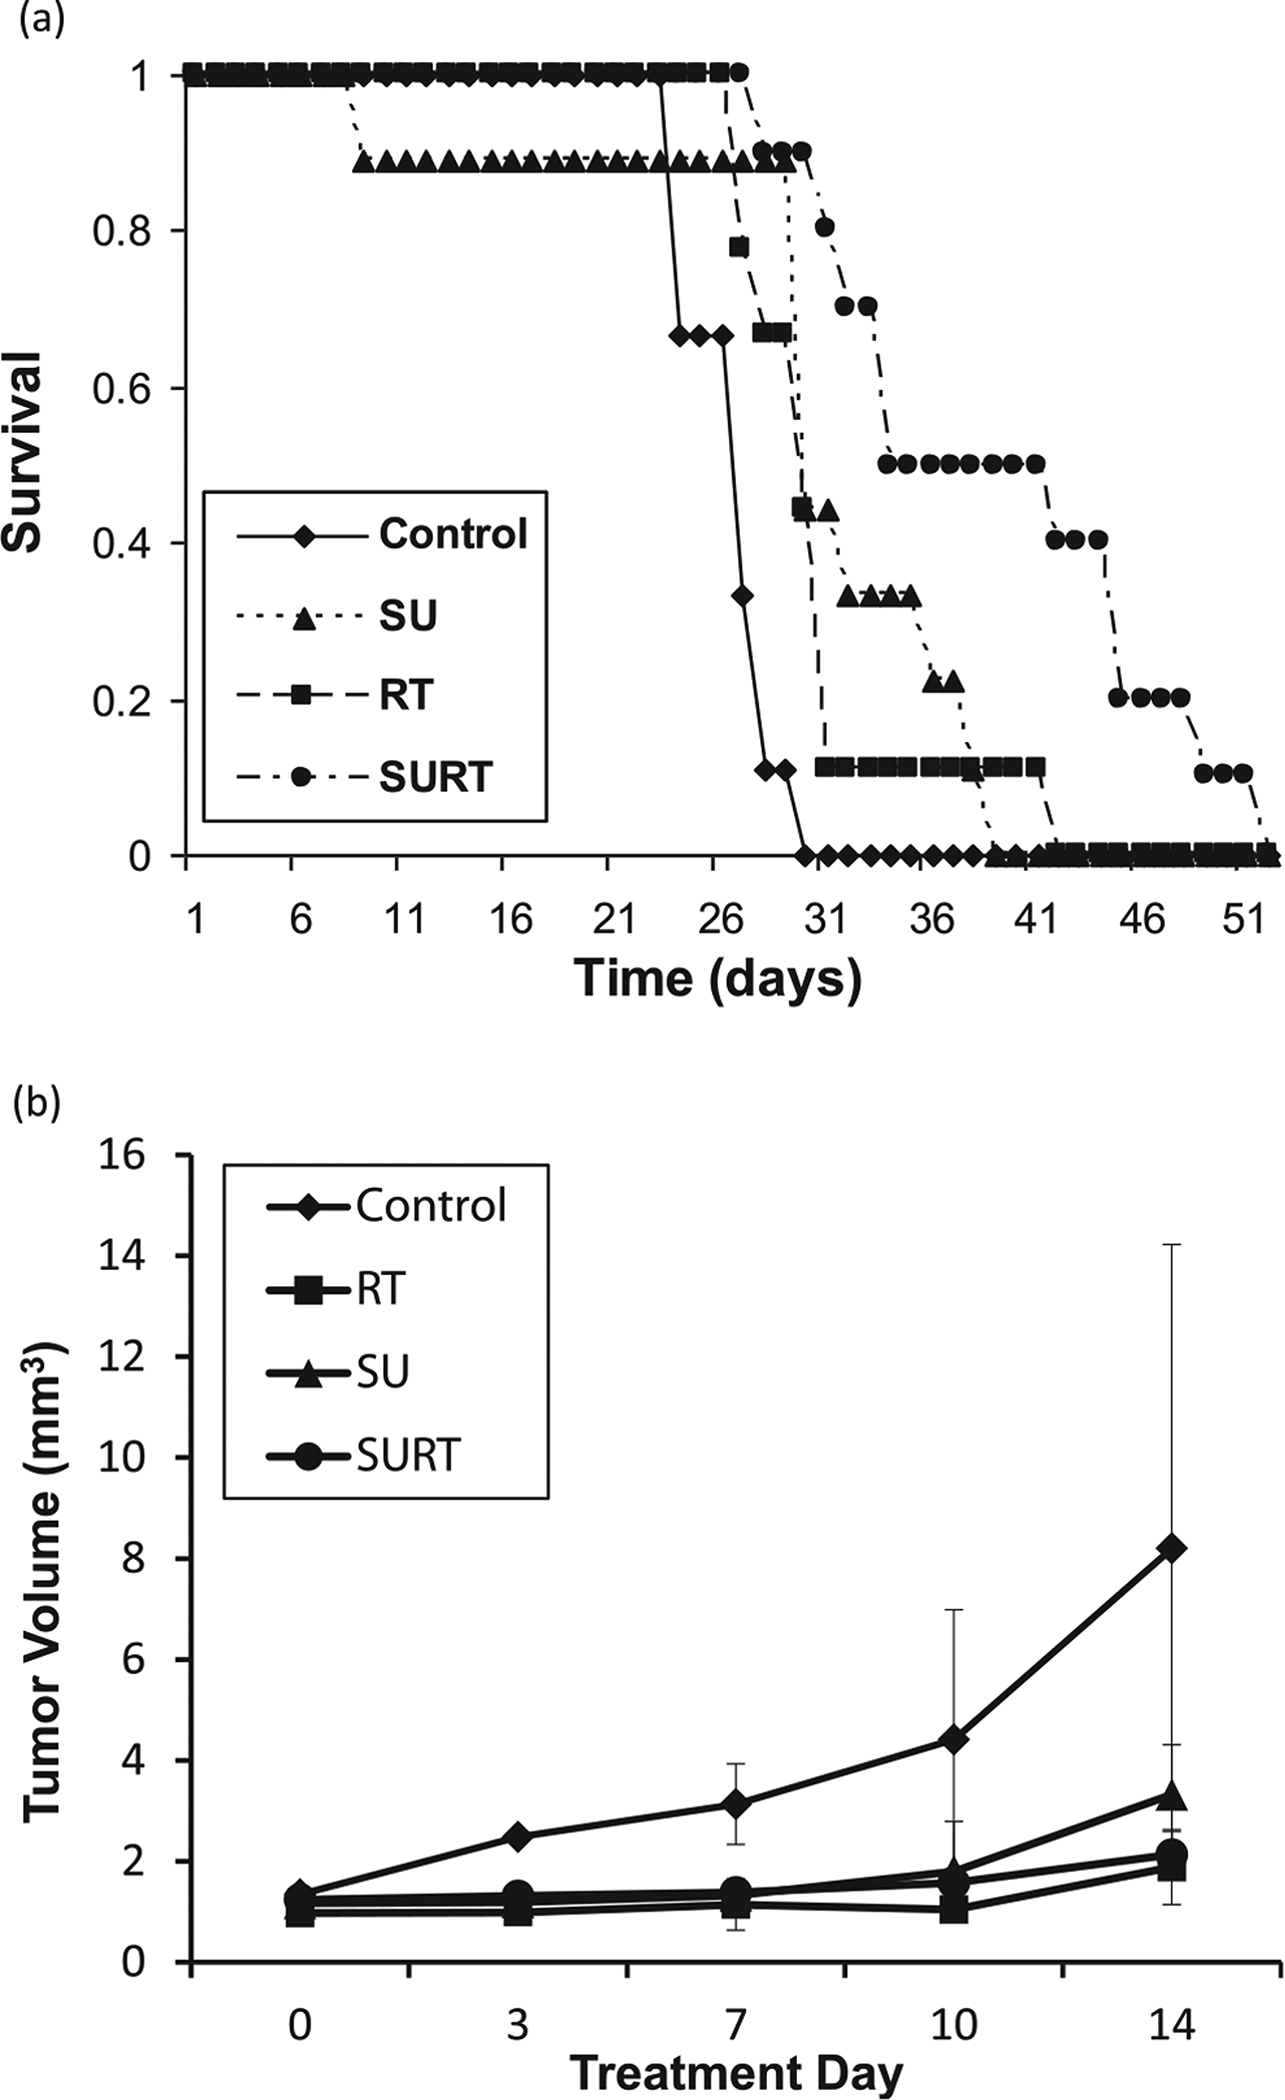
(a) Survival curves showing median survival of 35 days for SURT mice, 30 days for both RT and SU mice, and 26 days for control mice. (b) Tumor growth curves show tumor volume change over time. Mixed effects model analysis showed that overall tumor growth rate increases per day was lower for the 2 RT arms compared with control (P=.003) and SU (P=.005) mice.
Figure 3b shows tumor growth over time for each treatment arm. Following logarithmic transformation of tumor volume to stabilize the variance and obtain normally distributed residuals, a linear mixed effects model was used to estimate tumor growth rate for each mouse, using the tumor volume measurements at each imaging time point. Growth rates were significantly greater (P<.001) in the placebo and SU arms (0.08 and 0.098 cm3/day, respectively) than in the RT arm (0.029 and 0.025 cm3/day). There were no significant differences between growth rates in RT and SURT mice (P=.75) or between placebo and SU mice (P=.24).
Serial MRI biomarker analysis
Bi-weekly tail vein catheterization for serial DCE-MRI was successful through the course of the experiment. Of the mice followed with serial MRI and urine collection, 2 mice died due to technical difficulties during oral gavage and urine collection.
Diffusion
At baseline (Day 0), using respiratory gating to minimize the through-plane motion from respiration, we found the mean ADC ± standard deviation (SD) values were 797 ± 53 μm2/second for SURT mice, 862 ± 41 μm2/second for RT mice, 817 ± 13 μm2/second for control mice, and 827 ± 3 μm2/second for SU mice. Baseline contralateral brain ADC was similar in all arms: 764 ± 51 μm2/second. Even with respiratory gating, through-plane motion due to respiration resulted in slice-to-slice variation in ADC, and therefore, tumor ADC was normalized to the contralateral brain ADC on each slice to account for this variation. Figure 4b shows the trend in normalized tumor ADC, which shows that both RT arms had steeper rises in ADC from baseline over the course of the study than either of the non-RT arms. The ADC response, quantified as the ratio of the normalized ADC at Day X and normalized ADC at baseline (Day 0), was significantly greater in the RT arms (RT 2.67 and SURT 2.64) compared with those in the non-RT arms (control, 1.33; and SU, 1.15) as early as Day 3 (P=.002), with further increases to Day 14 (Fig. 4b). When the ADC response in individual tumors was plotted against the Ln (tumor growth rate), a strong correlation was observed both at Day 3 (R=−.85, P=.002) and Day 7 (R= −0.82, P=.007) (Figs. 6a and 6b). Figure 6a also shows that lower tumor growth rates and higher relative ADC values were consistently observed in mice treated with RT compared with those that were not. The correlation between Ln (tumor growth rate) and individual ADC response at Days 3 and 7 remained significant for all RT mice (R=−0.72 [P=.02] and R=−0.70 [P=.04]), respectively. For the non-RT mice, this correlation was not significant at Day 3 but was significant by Day 7 (R=−0.70 [P=.03]).
Fig. 4.

(a) Representative T1-weighted gadolinium-enhanced images and ADC maps at baseline and on treatment Day 3 (D3) for a mouse treated with SURT. (b) Mean normalized ADC (ie, normalized to contralateral brain to account for slice-to-slice variation from respiratory motion) over time (days) showing a significant rise in ADC for the 2 RT arms vs that in the non-RT arms (P=.00001) as early as Day 3.
Fig. 6.

Relationship between estimated Ln (tumor growth rate) using linear effects modeling for individual mouse tumor volume data and individual MRI responses at Day 3 and Day 7. Square = RT; circle = no RT; gray = SU; black = no SU (a, b). ADC response shows high correlation (b, c). Ktrans response was a weak association (c, d). Kep response shows no correlation.
Quantitative T1
Quantitative T1 of the contralateral normal brain remained stable from baseline to Day 14 at 2.5 ± 0.3 seconds. Baseline T1 in tumor was consistently lower than in normal brain, with a mean of 2.2 ± 0.2 seconds. No significant changes in tumor T1 were noted in any of the study arms over time. (Fig. 5c)
Perfusion
Modified Tofts kinetic modeling using individual T1 and AIF data, when available, demonstrated decreases in Ktrans of 27.6% for SU (P=.04) and 26.3% for SURT (P=.04) mice by Day 3 but no change in RT (P=.1) or control arms (P=.2) mice (Fig. 5a). With longitudinal follow-up, the reduction in Ktrans was sustained only for the duration of SU treatment for the SU arm but was sustained for the entire duration of the study for the SURT arm (Fig. 5a). The 2 SU arms also had significant decreases in Kep during SU treatment (SU, −38.1%; P=.01; and SURT, −27.3%; P=.02) beginning as early as Day 3, whereas no significant change from baseline was seen in the control or RT arm (Fig. 5b). There was a weak correlation between Ktrans and Ln (tumor growth rate), measured in individual tumors on Day 3 (R=0.46, P=.1) and Day 7 (R=0.49, P=.07) (Fig. 6). There was no association seen between the magnitude of Kep response and Ln (tumor growth rate) (Figs. 6e and 6f).
Of all acquired AIF and T1 measures, 9% of AIF and 15% of T1 acquisitions were excluded from DCE analysis due to imaging artifacts, predominantly stemming from respiratory motion. In the few cases when individual measures could not be acquired, the population mean T1 and population AIF based on all measurable mice were applied to the modified Tofts analysis. Figure 5d shows that applying individual mouse T1 measures in the modified Tofts analysis resulted in less variability in Ktrans response than applying the population mean T1 in the modified Tofts analysis for all mice (Fig. 5d).
Urine biomarker
Preliminary studies of serial urine samples with a commercially available antibody-based array revealed changes in angiogenic markers in the SU arms that confirmed systemic delivery and biological response to SU. There were decreases in the angiogenic markers VEGF, angiopoietin-1, and tissue factor-III, and increases in markers of invasion, including MMP-9 and TIMP-1. Increases in VEGF and EG-VEGF were noted following SURT (data not shown).
Discussion
A recent update from the Response Assessment in Neuro-Oncology Working Group recognized the limitations of monitoring tumor volume as a measure of treatment response, particularly for targeted therapy, and acknowledged the value of incorporating other physiological measures into future response criteria (11). In this study, serial multiparametric MRI allowed a single noninvasive imaging modality to monitor tumor volume response and identify early changes in measures of vascular perfusion and permeability (Ktrans and Kep) and water diffusion (ADC).
In this study, radiation was associated with a greater rise in ADC (Fig. 4b), and early ADC responses in individual mice were correlated with subsequent tumor volume response.(Figs. 6a and 6b). Prior studies have suggested that a rise in ADC is a sensitive measure of response to cytotoxic therapy and is associated with reduced cellularity, increased membrane permeability, and increased extra-cellular water content expected with cytotoxic therapy (5). Our findings support the fact that RT, a cytotoxic therapy, results in a significantly greater rise in ADC than SU therapy, which acts largely as an antiangiogenic agent with cytotoxic effects only at very high doses that were not used in this study (12). In our study, we did not observe a significant difference in ADC response between combined SURT and RTalone. Similarly, Larocque et al (13) did not observe a significant difference in ADC response with vascular manipulation prior to radiation. An inverse correlation between the magnitude of ADC response and tumor growth rate in groups of mice with subcutaneous GBM xenografts treated with escalating single doses of RT has been reported (14). Our study confirmed a similar relationship between ADC response and tumor growth rate for each treatment arm but noted variability in individual ADC response and tumor growth rates among mice within treatment arms. Despite individual variations, a similar inverse correlation between the magnitude of ADC response and tumor growth rate was observed not only for treatment arms but also for individual mice, regardless of treatment arm. (Figs. 6a and 6b). This suggests that ADC response may be a useful measure of individual treatment response and a useful predictive biomarker of subsequent tumor growth that is independent of tumor model (subcutaneous or intracranial) or treatment (RT and/or AA). A subsequent study by Larocque et al (15) has suggested that this ADC response is observed for both single-fraction and fractionated courses of radiation in a subcutaneous GBM xenograft model.
Prior studies of antiangiogenic therapy have demonstrated reductions in tumor perfusion and permeability using MR measures (Ktrans and Kep). Consistent with existing literature, SU treatment was associated with a relatively consistent early decrease in Ktrans and Kep, which was temporary for the SU arm but durable in the SURT arm. (Figs. 5c and 5d). This suggests that combined SURT may result in more durable vascular changes than SU alone. Recognizing that Ktrans and Kep results can depend on the T1 and AIF measures applied to the perfusion model, this study measured individual mouse T1 and AIF, demonstrating inter- and intramouse variability that has potential to impact the resulting Ktrans and Kep measures. Individual Ktrans responses to the limited course of SU administered in this study resulted in a weak association with subsequent tumor growth rate (Figs. 6c and 6d). A longer course of SU treatment may have a greater impact on tumor growth and may result in a stronger association between Ktrans response and subsequent tumor growth rate.
Limitations of this study are largely twofold: (1) difficulties with acquiring perfusion and diffusion measures in small volume tumors with appropriate spatial and temporal resolution; and (2) challenges of accurately and reproducibly defining these small ROIs for analysis. While voxel-by-voxel analysis would eliminate the uncertainty of defining an ROI, it is limited by inferior signal-to-noise relative to ROI analysis, particularly in small tumors of the size used in this study and introduces new challenges of tracking voxels over time.
Conclusions
This study identified several promising imaging biomarkers of early response to radiation and sunitinib therapy in a murine intracranial glioma model using serial multiparametric MRI. Consistent, significant rises in ADC in response to radiation and reductions in Ktrans in response to sunitinib were observed as early as Day 3 of treatment. For both treatment arms and individual mice, the magnitude of ADC increase was strongly associated with subsequent tumor growth, warranting further investigation. The rise in ADC in the control arm may be due to several factors including partial volume effects and central necrosis that may warrant further investigation. Future correlative histopathology will include analysis of tumor cell density changes in relation to ADC response and microvessel density changes in relation to Ktrans and Kep responses. Clinical translational investigation of these promising imaging biomarkers is being pursed in the context of several clinical trials of radiosurgery with and without sunitinib therapy for brain metastases. Ultimately, the development of early response biomarkers introduces the potential for personalized adaptive therapy approaches that may improve the efficiency of delivering effective therapy and minimize unnecessary toxicity, as patient treatments are adapted to their individual early responses.
Supplementary Material
Acknowledgment—
The authors thank the STTARR program for use of the animal facility and staff to assist in this project; Dr Anthony Brade for liaising with Pfizer to secure drug support for this study; Dr Andrea Kassner for input in developing the DCE-MRI protocol used; Jesper Kallehauge for time spent on and contribution to diffusion MRI analysis; and Dr Richard Hill for review and input during preparation of the manuscript preparation.
This research was supported by a Rapid Astrazeneca and CARO Evaluation of Radio-modifers (RAZCER) grant from Canadian Association of Radiation Oncology (CARO).
Footnotes
Conflict of interest: the drug sunitinib was provided by Pfizer for this study.
Supplementary material for this article can be found at www.redjournal.org.
References
- 1.Jain RK. Normalization of tumor vasculature: an emerging concept in antiangiogenic therapy. Science 2005;307:58–62. [DOI] [PubMed] [Google Scholar]
- 2.Citrin D, Menard C, Camphausen K. Combining radiotherapy and angiogenesis inhibitors: clinical trial design. Int J Radiat Oncol Biol Phys 2006;64:15–25. [DOI] [PubMed] [Google Scholar]
- 3.Schuuring J, Bussink J, Bernsen HJ, et al. Irradiation combined with SU5416: microvascular changes and growth delay in a human xenograft glioblastoma tumor line. Int J Radiat Oncol Biol Phys 2005;61:529–534. [DOI] [PubMed] [Google Scholar]
- 4.Moffat BA, Chenevert TL, Meyer CR, et al. The functional diffusion map: an imaging biomarker for the early prediction of cancer treatment outcome. Neoplasia 2006;8:259–267. [DOI] [PMC free article] [PubMed] [Google Scholar]
- 5.Chenevert TL, McKeever PE, Ross BD. Monitoring early response of experimental brain tumors to therapy using diffusion magnetic resonance imaging. Clin Cancer Res 1997;3:1457–1466. [PubMed] [Google Scholar]
- 6.Hillman GG, Singh-Gupta V, Zhang H, et al. Dynamic contrast-enhanced magnetic resonance imaging of vascular changes induced by sunitinib in papillary renal cell carcinoma xenograft tumors. Neoplasia 2009;11:910–920. [DOI] [PMC free article] [PubMed] [Google Scholar]
- 7.Bradley DP, Tessier JJ, Lacey T, et al. Examining the acute effects of cediranib (RECENTIN, AZD2171) treatment in tumor models: a dynamic contrast-enhanced MRI study using gadopentate. Magn Reson Imaging 2009;27:377–384. [DOI] [PubMed] [Google Scholar]
- 8.Faivre S, Delbaldo C, Vera K, et al. Safety, pharmacokinetic, and antitumor activity of SU11248, a novel oral multitarget tyrosine kinase inhibitor, in patients with cancer. J Clin Oncol 2006;24:25–35. [DOI] [PubMed] [Google Scholar]
- 9.Holash J, Wiegand SJ, Yancopoulos GD. New model of tumor angiogenesis: dynamic balance between vessel regression and growth mediated by angiopoietins and VEGF. Oncogene 1999;18: 5356–5362. [DOI] [PubMed] [Google Scholar]
- 10.Berrios-Otero CA, Wadghiri YZ, Nieman BJ, et al. Three-dimensional micro-MRI analysis of cerebral artery development in mouse embryos. Magn Reson Med 2009;62:1431–1439. [DOI] [PMC free article] [PubMed] [Google Scholar]
- 11.Wen PY, Macdonald DR, Reardon DA, et al. Updated response assessment criteria for high-grade gliomas: response assessment in neuro-oncology working group. J Clin Oncol 2010;28:1963–1972. [DOI] [PubMed] [Google Scholar]
- 12.de Bouard S, Herlin P, Christensen JG, et al. Antiangiogenic and anti-invasive effects of sunitinib on experimental human glioblastoma. Neuro Oncol 2007;9:412–423. [DOI] [PMC free article] [PubMed] [Google Scholar]
- 13.Larocque MP, Syme A, Allalunis-Turner J, et al. ADC response to radiation therapy correlates with induced changes in radiosensitivity. Med Phys 2010;37:3855–3861. [DOI] [PubMed] [Google Scholar]
- 14.Larocque MP, Syme A, Yahya A, et al. Temporal and dose dependence of T2 and ADC at 9.4 T in a mouse model following single fraction radiation therapy. Med Phys 2009;36:2948–2954. [DOI] [PubMed] [Google Scholar]
- 15.Larocque MP, Syme A, Yahya A, et al. Monitoring T2 and ADC at 9.4 T following fractionated external beam radiation therapy in a mouse model. Phys Med Biol 2010;55:1381–1393. [DOI] [PubMed] [Google Scholar]
Associated Data
This section collects any data citations, data availability statements, or supplementary materials included in this article.