



Abstract
Proteinaceous inclusions in neurons, composed primarily of α-synuclein, define the pathology in several neurodegenerative disorders. Neurons can internalize α-synuclein fibrils that can seed new inclusions from endogenously expressed α-synuclein. The factors contributing to the spread of pathology and subsequent neurodegeneration are not fully understood, and different compositions and concentrations of fibrils have been used in different hosts. Here, we systematically vary the concentration and length of well-characterized α-synuclein fibrils and determine their relative ability to induce inclusions and neurodegeneration in different hosts (primary neurons, C57BL/6J and C3H/HeJ mice, and Sprague Dawley rats). Using dynamic-light scattering profiles and other measurements to determine fibril length and concentration, we find that femptomolar concentrations of fibrils are sufficient to induce robust inclusions in primary neurons. However, a narrow and non-linear dynamic range characterizes fibril-mediated inclusion induction in axons and the soma. In mice, the C3H/HeJ strain is more sensitive to fibril exposures than C57BL/6J counterparts, with more inclusions and dopaminergic neurodegeneration. In rats, injection of fibrils into the substantia nigra pars compacta (SNpc) results in similar inclusion spread and dopaminergic neurodegeneration as injection of the fibrils into the dorsal striatum, with prominent inclusion spread to the amygdala and several other brain areas. Inclusion spread, particularly from the SNpc to the striatum, positively correlates with dopaminergic neurodegeneration. These results define biophysical characteristics of α-synuclein fibrils that induce inclusions and neurodegeneration both in vitro and in vivo, and suggest that inclusion spread in the brain may be promoted by a loss of neurons.
Keywords: NACP, SNCA, prion, aggregation, Parkinson disease
Introduction
α-Synuclein (α-syn) is the major component of filamentous inclusions in neurons found throughout the brain in several neurodegenerative diseases including Parkinson disease (PD) and Lewy body dementias (LBD) (Spillantini et al., 1998; Spillantini et al., 1997). Although there is evidence supporting pathological α-syn spread across interconnected neuronal networks, how this relates to selective vulnerability and neurodegeneration remains unclear (Surmeier et al., 2017). Recently, it has been demonstrated that the addition of pre-formed α-syn fibrils to neurons in vivo or in culture leads to the uptake of these particles and the corruption of endogenous α-syn into inclusions over time (Luk et al., 2012; Luk et al., 2009; Volpicelli-Daley et al., 2011).
Injection of α-syn fibrils into the rodent striatum, somatosensory cortex, entorhinal cortex, olfactory bulb, substantia nigra pars compacta (SNpc), or muscle, show that the fibrils induce inclusions that resemble those found in PD and LBD (Luk et al., 2012) (Masuda-Suzukake et al., 2014; Masuda-Suzukake et al., 2013; Rey et al., 2016) (Ayers et al., 2017; Paumier et al., 2015). In vivo imaging of cortical neurons previously exposed to fibrils demonstrates the overall cytotoxic nature of the inclusion (Osterberg et al., 2015). These inclusions are found at the site of injection and in interconnected brain regions. Thus, exposure of neurons to α-syn fibrils recapitulates several features of PD and LBD such as selective neuronal vulnerability, pathology in multiple brain regions, and progressive loss of neurons, without the need for genetic manipulation or over-expression of the protein that fibrillizes (i.e., α-syn).
Although it is clear that fibril exposure eventually leads to the death of some neurons, the relationship of the spread of pathology in the brain and overt cell loss (i.e., neurodegeneration) has not been well described. The degeneration of a neuron with inclusions that otherwise would transmit fibrils to neighboring neurons may prevent inclusion spread. Alternatively, cell loss may promote spread through an uncontrolled release of toxic species and fibrils. Further clouding interpretation of past studies using fibrils, the unknown or unreported concentrations of protein used (i.e., the number of fibril particles), species of the protein (i.e., human or mouse), and the amounts of α-syn protein applied to cells and the brain has widely varied. Recently, fibril length was demonstrated to be an important co-variable for inclusion formation in cell lines and in vivo (Tarutani et al., 2016). More complete biophysical characterizations of the fibrils and systematic implementation in different model systems may provide clues to help resolve the controversies.
Here, we sought to clarify several outstanding issues that may critically affect interpretation and implementation of the α-syn fibril model of neurodegeneration. We find that fibril concentration, not necessarily length, is an important potentially underappreciated variable that controls inclusion formation and neurodegeneration phenotypes in vitro and in vivo. Titration experiments reveal a very narrow dose-response of fibril concentration to endogenous α-syn expression in the formation of inclusions in vulnerable neurons. We find that the injection of the SNpc with fibrils induces a robust neurodegenerative response like fibril injections in the striatum. Injection of the SNpc also causes the spread of inclusions to spiny projection neurons in the striatum, and this process strongly correlates with neuron loss in the SNpc six-months post-fibril injection. By defining the critical biophysical fibril parameters related to phenotypes in vitro and in vivo, future studies will be better poised to resolve the most pressing issues related to α-syn-linked neurodegeneration.
Results
Dynamic light scattering profiles short α-syn fibrils
α-Syn fibrils seed the formation of inclusions in neurons in culture and in the mouse and rat brain. To generate fibrils, we purified mouse and human α-syn protein from bacteria to a high purity and incubated monomer protein with shaking until turbid. After ultracentrifugation at 100,000 × g, >90% of the α-syn protein was found in the pellet fraction (P100), with <10% remaining in the supernatant (Figure 1A, S100 fraction). Analysis via non-denaturing blue-native PAGE efficiently separated monomeric protein that migrated at ~56 kDa from fibrils that all migrated above 500 kDa in size (Figure 1B). Increasing the amount of sonication time did not convert any of the higher-molecular weight conformations into monomer based on native PAGE analysis.
Figure 1. Electron microscopy characterization of α-syn fibrils after extensive sonication.

A) Denaturing gel electrophoresis and Coomassie stain for volumetric sedimentation analysis of a pellet fraction (P100) or supernatant fraction (S100) of recombinant mouse α-syn fibrils, post-ultracentrifugation (100,000 × g for 1 hour). B) Non-denaturing blue-native PAGE, with the indicated sonication treatment time above each lane. Monomer α-syn migrated at ~ 56 kDa. C) Representative negative-stain transmission electron micrographs of unsonicated mouse α-syn fibrils, monomer, or fibrils sonicated for 30 sec, and up to 240 sec, as indicated. Scale bars are 50 nm. D–G) Histogram representation of more than 1,000 particles measured from each condition from randomly captured electron microscopy images. Selected sonication times, as indicated, are shown from representative preparations. Red bars represent group median, with mean and corresponding group standard deviation indicated in bold font. H) Summary graph of the effect of sonication on fibril length. Data points represent group means.
Examination of the fibrils by transmission electron microscopy showed typical filaments. Increasing total times of sonication generally reduced fibril length (e.g., 30 seconds to 240 seconds, Figure 1C). Analysis of monomer protein by electron microscopy did not reveal the presence of aggregated protein or filaments, consistent with native PAGE results. We measured the lengths of thousands of particles from different preparations of fibrils and plotted the distributions as histograms (Figure 1 D–G). While an average α-syn fibril length can be calculated from a distribution, breakage of fibrils into smaller fragments becomes much less efficient as the fibrils become shorter. Only a few nanometers average length (e.g., ~four α-syn monomer subunits) was different in doubling sonication times from 60 seconds, to 120 seconds, to 240 seconds (Figure 1H). ~Two α-syn monomer subunits likely represent one nanometer of fibril (Serpell et al., 2000). These results are potentially consistent with past studies demonstrating longer protein fibrils (e.g., composed of insulin protein) are stiff and brittle and subject to fracture, whereas shorter fibrils become increasingly fracture-resistant because they can bend and absorb otherwise shearing forces (Fitzpatrick et al., 2015; Knowles and Buehler, 2011).
Thioflavin binding demonstrated that increasing sonication times and shortening fibrils did not destroy the amyloid conformation of the α-syn fibrils (Figure 2A), and that the shortest α-syn fibrils we could generate could seed the formation of new fibrils in vitro (Figure 2B). Consistent with these results, circular dichroism demonstrated that these short α-syn fibrils remained structurally like the longer fibrils (Figure 2C). To determine whether other biophysical characteristics were changing with extensive sonication, we compared dynamic light scattering profiles. Light scattering changed with increasing sonication, and intensity distributions were used to calculate concentration (Figure 2D,E). Increasing sonication time progressively reduced the molecular weight and increased concentration of the fibrils in a linear manner (Figure 2E). To test whether the fibril preparations were functionally increasing in concentration with respect to seeding capability of new fibrils, we included the same weight of each fibril preparation together with monomer protein (1:20 w/v) into a thioflavin binding assay and observed a proportional increase in seeding capacity, in close agreement with the light scattering predictions (Figure 2F).
Figure 2. Prediction of α-syn fibril length and concentration by dynamic light scattering.

A) Thioflavin binding assay of unsonicated (195 nm) and sonicated mouse α-syn fibrils, with equal α-syn mass (i.e., 5 μg in 100 μl) included in each condition. B) Fibril outgrowth assay based on recruitment of free monomer protein (mouse α-syn) with and without 29 nm seeds (mouse α-syn). Seeds were included at a ratio of 1:20 fibril to monomer (weight). Heavily sonicated fibrils retained the ability to seed new fibril growth as evidenced by thioflavin binding. C) Representative circular dichroism profiles of sonicated α-syn fibril preparations, with fibril profiles indistinguishable between each other, but readily distinguished from monomeric protein. D) Histograms depict dynamic light scattering profiles obtained for each sonicated α-syn fibril preparation, plotted relative to the intensity-distribution predicted molecular weight (Dyna V6.3.4 software). E) Relationship between the average in-solution molecular weight and the calculated molarity (light scattering profiles) of sonicated fibril preparations in a typical solution strength (i.e., 0.2 μg mL−1) used to study α-syn fibrils in cell culture experiments (e.g., Figure 3). F) Thioflavin binding over time, with monomer (mouse α-syn) included in reactions at 5 mg mL−1, with or without the addition of 1 mg mL−1 of the indicated fibrils (mouse α-syn). All results are representative of at least three independent experiments.
Concentration-dependent fibril seeding phenotypes in primary neurons
The addition of fibrils to primary hippocampal neurons seeds the recruitment of endogenous α-syn into inclusions that can be identified with an antibody to pS129-α-syn (Volpicelli-Daley et al. 2011). A recent study demonstrated that reducing fibril length to less than 50 nm and transfecting these fibrils into SH-SY5Y cells caused robust inclusion formation when the cells were transiently transfected with α-syn (Tarutani et al., 2016). However, past studies have not described fibril concentration (i.e., number and length of particles) effects with respect to inclusion formation from endogenously expressed protein in cultured neurons. Past studies have also utilized both human and mouse α-syn to template new inclusions in cells that over-express α-syn (Peelaerts et al., 2015). Further, a significant species barrier has been recently identified for human fibrils templating new mouse fibrils in primary neurons (Luk et al., 2016).
To test different concentrations of fibrils with respect to the concentration of α-syn endogenously expressed in the neurons (Supplemental Figure 1), we titrated 49 nm (average) human and mouse fibrils (30 second sonication condition, Figure 1) to induce inclusions in primary neurons. We verified by silver-stain denaturing PAGE analysis that preparations of human and mouse fibrils were comparable to one another and contained the same amount of α-syn protein (Figure 3A). Fibrils were added to neurons at seven days in vitro (DIV), and cultures were immunostained fourteen days later. Immunofluorescence was performed using antibodies to tau, to visualize axons, NeuN to visualize neuronal nuclei, and to pS129-α-syn to visualize inclusions. Monomeric α-syn does not template new inclusions and pS129-α-syn signal in these cultures was used as a threshold cut-off (Volpicelli-Daley et al., 2011). Signal from pS129-α-syn was also defined in α-syn knockout neurons to ensure only authentic inclusions derived from α-syn were analyzed (Supplemental Figure 2). We found that femptomolar concentrations of the fibrils were sufficient to induce widespread inclusions throughout the cultures (Figure 3B–F). Inclusions could be broadly categorized as larger inclusions in the soma or thin filaments in axons.
Figure 3. Femptomolar concentrations of α-syn fibrils template inclusions in the soma and axon in primary neurons.

A) Denaturing PAGE and silver stain of rodent and human α-syn fibril preparations (49 nm fibrils, 30 sec sonication), with fibrils solubilized and boiled in SDS buffer prior to gel loading. The indicated amount of fibrils loaded to each gel is indicated. B–F) Representative wide-field fluorescence images gathered by automated microscopy from neurons in culture. Immunofluorescence depicts tau signal (red) in primary hippocampal neurons (DIV 21), treated with the indicated concentration of 49 nm human α-syn fibrils at DIV 7 (i.e., 14-day incubation). Green depicts signal from pS129-α-syn antibody. The concentration of endogenous α-syn in these cultures is given in Supplemental Figure 1, and results in α-syn knockout neurons (to control for pS129-α-syn staining unrelated to newly generated α-syn fibrils) is given in Supplemental Figure 2. Scale bar shows 40 μm.
As the endogenous substrate (i.e., α-syn) is critical to the formation of new fibrils in neurons, we measured the concentration of endogenous α-syn in the neurons at the time of fibril addition and compared this to the amount of α-syn fibrils added. We calculated ~110 ng of α-syn per well, or ~0.3 pg of α-syn protein per neuron on average, representing nearly 0.2% of the total amount of protein in the culture (Supplemental Figure 1). Notably, this concentration is higher than that reported in purified synaptosomes from rat brain (Wilhelm et al., 2014). To quantify pathology in the neurons at different ratios of fibril seeds (49 nm average) to substrate, we developed an automated imaging platform for unbiased inclusion quantification. The addition of fibrils at a ~1:50 ratio of fibril weight to endogenous α-syn (w/v, 0.1 pM rodent α-syn, ~2 ng mL−1 Figure 4A,B) induced inclusions in ~1% of the possible tau-positive process area in the culture and ~1% of NeuN bodies (Figure 3D). At concentrations of fibrils greater than 1 pM (i.e., 1:5 ratio of w/v of α-syn in fibrils to total α-syn in the neurons), human fibrils seeded comparably to mouse fibrils. There was no difference in the amount of soma inclusions that could be quantified between 10 pM and 100 pM fibril exposures of either human or mouse fibrils (fibril weight exceeding the amount of endogenous α-syn), indicating a ceiling effect. ~12–15% of all NeuN bodies were susceptible to developing an inclusion and ~4% of all tau-positive area could be identified with inclusions (Figure 4A,B and Figure 3F). We did not observe a significant loss of tau-positive process area under any of the fibril exposures or loss of NeuN-positive bodies (Figure 4C,D and 4G,H), suggesting the overt loss of cells was unlikely to introduce a confounding variable to the analysis.
Figure 4. α-Syn fibril concentration and length on templating new inclusions in primary neurons.

A) Unbiased quantification of the percent occupancy of α-syn inclusions in tau-positive processes, caused by exposure to the indicated concentration of 49 nm mouse or human fibrils (as indicated). Control images from monomer α-syn treatments were used as a threshold for pS129-α-syn inclusion signal (background). B) Unbiased quantification of the percentage of NeuN bodies in each image that overlap with an pS129-α-syn inclusion. C,D) The average tau-area and number of NeuN bodies analyzed per data point for each group are given as column graphs. E) Unbiased quantification of the percent occupancy of pS129-α-syn inclusions in tau-positive processes, and F) soma inclusions, caused by the indicated (mouse) fibril preparation. G,H) The average tau-area and number of NeuN bodies analyzed per data point for each group in panels E and F are given as column graphs. Over one-hundred images were analyzed in at least three independent experiments for each group. * n.s. is not significant, * is p<0.05, ** p<0.01, *** p<0.001, as determined by one-way ANOVA with a Tukey’s post-hoc test. Supplemental Table 1 shows results of post-hoc tests of all groups.
Fibril length has been proposed as a critical determinant for fibril seeding but has not been demonstrated in cells that express endogenous levels of α-syn (Tarutani et al., 2016). We determined whether reducing fibril length at higher concentrations of α-syn would change inclusion profiles and potentially expand the number of neurons that could develop pathology. Unsonicated fibrils (but subjected to one freeze-thaw cycle, ~195 nm on average) were less efficient than all of the sonicated fibrils (Figure 4E,F). Shortening fibrils beyond 100 nm did not induce more inclusions either in the soma or axons. In summary, these results show 1) a narrow dynamic range for inclusion formation in concentration gradients (10 fM to 100 pM tested) of exogenous fibrils, 2) the lack of a species barrier in human fibrils cross-seeding mouse inclusions in neurons, 3) a general lack of effect of fibril length (195 to 29 nm range tested) for seeding new inclusions in primary neurons.
Fibril-induced α-syn pathology and dopaminergic neurodegeneration in rodents
α-Syn fibril injections have been described in several mouse strains including C57BL/6 and C3H (Luk et al., 2012), as well as rats (Paumier et al., 2015). To test fibril length and strains of rodents in inclusion formation and spread in the brain, we injected a series of mice (C57Bl/6J and C3H/HeJ) and rats (Taconic Sprague Dawley) unilaterally in the dorsal striatum with a constant amount of α-syn protein in all conditions. Six months after injection, we analyzed the number of pS129-α-syn inclusions that formed in neurons near the injection site in the striatum as well as in brain nuclei that are known to project to the striatum. In all groups of rodents, an equivalent mass of monomer α-syn protein was injected, as well as sections analyzed from α-syn knockout rodents (Supplementary Figure 3), to distinguish authentic pS129-α-syn inclusions from off-target and background staining. Except for monomer α-syn injections that never generated inclusions, all rodent brains demonstrated inclusions of variable number in the dorsal striatum, amygdala, piriform cortex, and thalamus.
In the striatum of C57BL/6J, the abundance of inclusions increased dramatically with the injection of short 29 nm fibrils compared to the same weight of 195 nm fibrils (Figure 5A–D). These inclusions were morphologically similar to those formed in primary neuron cultures (Figure 3), and soma inclusions were always adjacent or overlapping with NeuN-positive cells in the striatum (Figure 5F–H). Neuritic inclusions in the striatum were mostly negative for tyrosine hydroxylase (TH, Figure 5I), but occasionally overlapped with TH expression in shorter inclusions (Figure 5J). The somatic inclusions localized to striatal projection neurons and we did not detect an instance of a ChAT interneuron with an inclusion (Figure 5K–L).
Figure 5. Short α-syn fibrils induce inclusions in C57BL/6J spiny projection neurons.

Adult (~P90) mice were unilaterally injected with the indicated mouse α-syn fibril preparation, or monomeric α-syn. Six months later, mice were sacrificed and the dorsal striatum was analyzed by immunohistochemistry for pS129-α-syn inclusions by DAB immunohistochemistry and by confocal microscopy. A–E) Representative lower magnification images in coronal dorsal striatum sections adjacent to the needle track of α-syn (mouse) fibril injection. Scale bars are 200 μm and 100 μm (Panel E). F–H) Higher magnification of individual NeuN-positive neurons or fibers in the striatum, with NeuN (Panel F) or tyrosine-hydroxylase (red, Panels G–J) staining. Scale bars are 40 (Panel F) and 20 μm. K,L) pS129-α-syn inclusions (green) and acetyl cholinesterase (red) in the dorsal striatum, scale bars are 100 and 20 μm, respectively. Results are representative of at least three mice analyzed per group.
The amygdala has prominent projections to the site of our fibril injections in the dorsal striatum (McDonald, 1991) and neurons throughout the amygdala developed robust neuritic and somatic inclusions adjacent to NeuN-positive nuclei (Figure 6A). The amygdala inclusion load corresponded well to the inclusion load in the striatum, with higher concentrations of short fibrils inducing more robust pathology. A small fraction of dopaminergic neurons in the SNpc also developed inclusions (Figure 6B1–3). Confocal analysis of cell bodies in the SNpc revealed inclusions that tended to spiral around the nucleus of dopaminergic neurons (Figure 6B4–6). Every cell in the SNpc with an inclusion was TH-positive and TH staining did not appear reduced in these cells.
Figure 6. Short α-syn fibrils induce pS129-α-syn inclusions in brain nuclei that project to the dorsal striatum.

Adult (~P90) C57BL/6J mice were injected unilaterally in the dorsal striatum with 10 μg of the indicated mouse α-syn fibril preparation (195 nm or 29 nm), or 10 μg of monomer α-syn, and analyzed 6 months later by immunohistochemistry for pS129-α-syn and by confocal microscopy in brain nuclei that project to the dorsal striatum (i.e., amygdala, cortex [piriform], SNpc). A1–3) Representative immunohistochemistry (DAB, brown coloration for pS129-α-syn) in the ipsilateral amygdala, scale bars are 100 μm. A4) Representative triple-label confocal microscopy showing pS129-α-syn (green), DAPI (blue) and NeuN (red), in the amygdala. pS129-α-Syn inclusions could be detected both adjacent to NeuN-positive neuronal nuclei, as well as NeuN bodies. Scale bar is 50 μm. B1–3) Representative immunohistochemistry (DAB, brown coloration) in ipsilateral SNpc (highlighted by dashed lines). Scale bars 0.2 mm. B4–6) Quadruple-label confocal microscopy showing several tyrosine-hydroxylase (TH) positive neurons in the ipsilateral substantial nigra pars compacta, with pS129-α-syn (green), TH (red), NeuN (Blue) and DAPI (white). Panel B4 shows a NeuN-negative TH-positive neuron with a pS129-α-syn inclusion, B5 shows another NeuN negative neuron with an inclusion and a pyknotic nucleus at higher magnification, and B6 shows a TH-positive/NeuN positive neuron with much smaller pS129-α-syn inclusions. C1–3) Ipsilateral somatosensory cortex with pS129-α-syn immunohistochemistry (DAB, brown coloration), scale bars 100 μm. C4) Confocal microscopy with pS129-α-syn (green), and C5) NeuN (red), and DAPI (Blue). C4 shows a cross section (coronal) of the ipsilateral somatosensory cortex (scale bar is 100 μm). C5 shows two pyramidal neurons in the piriform cortex, one positive with an inclusion next to one without (scale bar is 25 μm). Results are representative of at least three mice analyzed per group.
Several cortical regions demonstrated inclusions after injection of the striatum. The piriform cortex and somatosensory cortex (Figure 6C1–3) were prioritized for analysis because these brain regions avoided the needle tract of fibril injection. Confocal analysis of these cortical areas showed that all the inclusions were associated with NeuN positive cells, with fibril-spiral inclusions in pyramidal neurons in the piriform cortex (Figure 6C4–5). The inclusion burden in shorter-fibril (29 nm) injected C57BL/6J was more robust compared to longer-fibril (195 nm) injected animals. Long-fiber injected C57BL/6J demonstrated very sparse inclusions in every brain region. In contrast to C57BL/6J, C3H/HeJ mice appeared to be insensitive to fibril length, as both longer-fibrils and shorter fibrils produced very similar and robust inclusion profiles in the different brain regions (Figure 7). Thus, the 29 nm short-fibril injections of C57BL/6J and C3H/HeJ produced inclusions of similar abundance. But, (Figure 5–7), the long fibrils (195 nm) only produced robust inclusions in C3H/HeJ mice.
Figure 7. Both long and short α-syn fibrils induce inclusions in C3H/HeJ mice.

Adult (~P90) C3H/HeJ mice were injected unilaterally in the dorsal striatum with 10 μg of the indicated mouse α-syn fibril preparation (195 nm, 49 nm, or 29 nm), or 10 μg of monomer α-syn, and analyzed 6 months later by immunohistochemistry for pS129-α-syn in the A) dorsal striatum (scale bar 0.1 mm), B) amygdala (scale bar 0.1 mm), C) piriform cortex (scale bar 0.1 mm), and D) SNpc (highlighted by dashed lines, scale bar 0.2 mm). Representative immunohistochemistry (DAB, brown coloration for pS129-α-syn) in the ipsilateral nucleus is shown. Results are representative of at least three mice analyzed per group.
Fibril injections in rats also induces pS129-α-syn inclusions (Paumier et al., 2015). We performed unilateral injections into the dorsolateral striatum in Sprague Dawley rats with the same fibril preparations used in mice and analyzed brain sections six-months post-injection. We observed a remarkably similar distribution of inclusions as compared to C57BL/6J mice (Figure 8). Inclusions appeared in the amygdala, piriform cortex, and SNpc and the abundance of inclusions was most robust with the higher concentration of the short fibrils fibrils (Figure 8A4, B4, C4, D4). In contrast, longer fibrils (i.e., 195 nm) produced very sparse to no inclusions in these areas, similar to C57BL/6J. Monomer α-syn protein injections in the rats failed to produce detectable inclusions in any of these brain regions. Overall, we can confirm that shorter fibrils injected into the brain are more efficient in seeding inclusions in Sprague Dawley rats and C57BL/6J. The C3H/HeJ strain appears to be more sensitive to inclusion formation than the other rodents tested, with longer-fibrils performing equivalently to shorter fibrils in seeding inclusions.
Figure 8. Short α-syn fibrils induce inclusions in Sprague Dawley rats.

Adult (~P90) rats were unilaterally injected with 20 μg of the indicated rodent α-syn fibril preparation, or 20 μg of monomer α-syn. Six months later, rats were sacrificed and coronal sections were analyzed by immunohistochemistry for pS129-α-syn (DAB, brown coloration). A1–4) Representative images in sections adjacent to the needle track of the fibril injection. Scale bars are 200 μm. B1–4) Representative images in the ipsilateral somatosensory cortex (scale bars 100 μm), C1–4) SNpc (highlighted by dashed lines, scale bar is 200 μm), or D1–D4) amygdala (scale bar is 200 μm). Images from each brain nuclei are representative of at least three rats analyzed per group.
Striatal injections of fibrils have been reported to cause a ~30% loss of dopaminergic neurons in the SNpc in rats and mice six-months post-injection (Luk et al., 2012; Paumier et al., 2015). We determined whether varying the inclusion burden in the rodent brain via manipulation of fibril length and using different mouse strains or rats would correlate with dopaminergic neurodegeneration. We developed a series of rats and mice and injected fibrils of various lengths into the striatum and counted inclusions through the SNpc six-months post-injection (Figure 9A). We ranked the pathology in three other brain regions (piriform cortex, amygdala, and thalamus) from zero (no detectable inclusions), one (one or a few inclusions), to five (the highest burden of inclusions), in mice and rats (Figure 9B). We also counted TH+ (Nissl counterstained) positive cells in ipsilateral SNpc and contralateral SNpc using unbiased stereology (see Methods). In many of these animals, a clear reduction in the number of TH-positive cells in the ipsilateral SNpc could be observed (Figure 9C). In counting the number of TH stained cells through the SNpc and plotting the percent loss (ipsilateral SNpc to contralateral SNpc) against the inclusion burden (Figure 9A–B), we observed a trend where animals that had the highest numbers of inclusions in the SNpc (Figure 9D) and brain regions connected to the striatum (Figure 9E) typically had higher levels of dopaminergic neurodegeneration. In these animals, the same amount (mass) of α-syn was injected, but little to no neurodegeneration could be observed in animals that failed to develop inclusions.
Figure 9. α-Syn inclusion burden correlates to the loss of dopaminergic neurons in the SNpc.

Adult (~P90) mice (C57BL/6J and C3H/HeJ, as indicated) and Sprague Dawley rats were unilaterally injected in the dorsal striatum with 10 μg (mice) or 20 μg (rats) of fibrils (mouse) of the indicated composition of fibrils (195-29 nm, monomer controls included). Six months later, all rodents were sacrificed and coronal sections through the brain were analyzed by immunohistochemistry. A) Unbiased stereological counts of the number of soma pS129-α-syn inclusions through the SNpc. B) Observer-ranked pS129-α-syn inclusion burden. “Pathology score” in each brain region (piriform cortex, amygdala, thalamus) is assigned a rank of 0–5 (see Methods). C) Representative immunohistochemistry of the SNpc and VTA for TH reactivity. A light Nissl stain is in blue to identify the SNpc, scale bar is 0.5 mm. D) Comparison of stereological counts of inclusions throughout the SNpc (Panel A) to the amount of dopaminergic neurodegeneration measured in the same animal using stereological counts (see Methods). E) Ranked inclusion burden in the cortex, amygdala and thalamus, (Panel B) plotted against the amount of dopaminergic neurodegeneration. Linear trend line fits are presented along with Spearman rank correlation values in a 95% confidence interval. Error bars are S.E.M. Results are from at least three rodents analyzed per group.
pS129-α-Syn inclusion burden positively correlates with dopaminergic neurodegeneration
Our fibril injections into the striatum resulted in a few hundred neurons in the SNpc with inclusions we could detect versus the thousands of neurons that remain (Figure 9A). Formation of pS129-α-syn inclusions may occur first in axons, followed by inclusion appearance in the soma over time. In vitro inclusion formation occurs more readily in axons compared to the soma, likely because of the high concentration of α-syn at the presynaptic terminal relative to the cell body (Volpicelli-Daley et al., 2011). We determined whether fibril exposures at the dopamine neuron cell body would 1) increase the number of inclusions in the SNpc, 2) cause toxicity unrelated to inclusion formation or fibril length, and 3) whether inclusions would spread in other brain regions different from striatum injections. We injected 49 nm mouse α-syn fibrils into the SNpc or striatum in a series of rats and analyzed brain sections six-months post-injection. In both SNpc or striatum injections, a comparable number of SNpc neurons demonstrated inclusions. In addition, spiny projection neurons in the striatum developed inclusions both with striatal and SNpc injections. When fibrils are injected in the SNpc, inclusion spread to spiny projection neurons may represent a straightforward assay to measure inclusion formation distant from the injection site. The amygdala also showed an indistinguishable inclusion load between the two groups of animals (Figure 10B2 and C2). One difference between the two injection sites was the obviously less abundant inclusion spread to the cortex, with sparse or no inclusions detectable in the piriform or somatosensory cortices in SNpc injected rats compared to striatum injected rats (Figure 10). This may reflect the relative sparsity of cortical projections to the SNpc.
Figure 10. α-Syn fibril injections in the rat SNpc induce robust inclusions.

A) Adult (~P90) rats were unilaterally injected in the SNpc or dorsal striatum with 20 μg of 49 nm fibrils, and 6 months later, rats were sacrificed and coronal sections were analyzed by immunohistochemistry for pS129-α-syn (DAB, brown coloration). B1–5) Representative bright field images of brains injected in the striatum. Prominent pS129-α-syn pathology localizes near the injection site in the striatum (shown), in the amygdala, some inclusions in the SNpc, and widespread inclusions throughout the cortex. C) Injection directly in the SNpc produces fewer inclusions in the striatum (C1), a comparable inclusion load in the amygdala and SNpc (C2 and C3), and very few or no inclusions through much of the cortex (C4 and C5). Scale bars are 100 μm. Results are representative from over 20 rats analyzed.
Stereological counts for TH+ SNpc cells after injection in the SNpc of rats revealed a heavy lesion (on average 50% loss, but greater than 95% in a few rats, see Figure 11A1) due to the injection of short (49 nm) mouse α-syn fibrils. We did not observe an obvious loss of cells or loss of TH signal in the adjacent ventral-tegmental area. Plotting the absolute counts of TH+ SNpc cells revealed the possibility of contralateral TH cell loss in some of the rats (Figure 11A2). However, the extent of neurodegeneration in the ipsilateral SNpc did not appear to correspond well with the extent of contralateral neurodegeneration, revealing the complexity of the relationship of ipsilateral to contralateral neurodegeneration (Figure 11A3). Injection of the comparable mass of monomer α-syn failed to produce any detectable loss of cells in any of the rats, suggesting that the surgical procedure of fibril injection or other components included in the injection besides fibrils were unlikely to elicit a neurodegeneration phenotype, at least on their own (Figure 11A,B). Plotting neurodegeneration as a function of striatum inclusion count in the SNpc fibril-injected rats revealed a strong positive correlation (r=~0.8) between spiny projection neurons with inclusions and the extent of neurodegeneration in the SNpc (Figure 11C).
Figure 11. Inclusion spread from the SNpc to striatal projection neurons correlates with dopaminergic neurodegeneration.
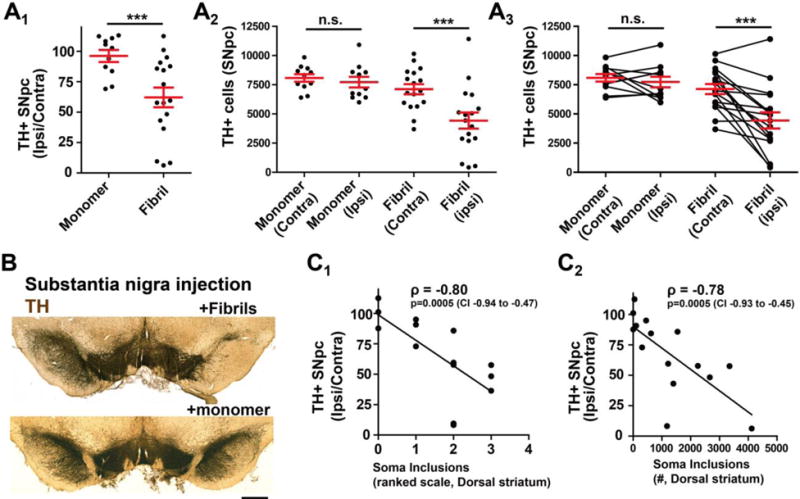
Adult (~P90) rats were unilaterally injected in the SNpc with 20 μg of 49 nm fibrils, and 6 months later, rats were sacrificed and A) coronal sections were analyzed by immunohistochemistry for pS129-α-syn (DAB, brown coloration) and tyrosine-hydroxylase (TH, with Nissl, blue coloration). Unbiased stereological counts for Nissl+ neurons, defined by either TH expression or more rarely (e.g., <5% of total cells) Nissl-alone reactivity in large (>~40 μm) Nissl-positive bodies, as presented in column graphs that show mean and S.E.M. with red bars. Each data point represents a rat. A one-way ANOVA was performed (monomer and fibril rats, ipsi versus contra counts) and was significant (p<0.001), and a post-hoc analysis (Tukey’s) revealed the fibril treated ipsilateral SNpc is different from the other groups. B) Representative immunohistochemistry for the fibril-injected rat group (TH stain, brown, with a light Nissl stain, blue), scale bar is 0.5 mm. C) Scatterplot for a ranked-scale of striatum pathology (see Methods section) and stereological counts for soma inclusions scored through the rat striatum, compared to the amount of neurodegeneration (presented as ipsilateral counts over contralateral counts), with a linear trend line fit, and a Spearman rank correlation value shown in bold font with a corresponding 95% confidence interval.
Discussion
Our results center on three novel observations: First, fibril breakage through sonication predictably increases fibril concentration that can be conveniently quantified by dynamic light scattering. While the mass amount of α-syn used in experiments in past studies is typically reported (e.g., in μg), this may be an insufficient characterization to allow cross-replication. Our results show that better biophysical characterizations may help guide experimental design and endpoints that may be more meaningful. For example, we can show that neurons in culture respond to increasing concentrations of fibrils in seeding new inclusions, but the window for such effects is narrow and the response is relatively flat. Further, we could describe a ceiling effect when the amount of α-syn added approaches the amount of endogenous α-syn protein expressed, along with a bottom threshold effect where no inclusions form at all with lower concentrations. These results would call into question the physiological relevance of studying α-syn inclusion formation in the context of heavy over-expression of α-syn. Second, we find that after six months, fibrils injected in either the SNpc or striatum produce a remarkably similar inclusion profile in the midbrain and basal ganglia, with similar dopaminergic neurodegeneration. Third, we find that the mice and rats with the highest inclusion burden tend to also have the highest dopaminergic cell loss in the SNpc. The strongest correlation was between striatal inclusion burden and dopaminergic cell loss in SNpc. The striking difference we could describe between C57BL/6J and C3H/HeJ mice highlight this relationship and show how mouse strain effects could potentially influence results. The correlation between inclusion spread and neurodegeneration supports a model where the inclusions are either causative or, at least, reactionary to a neurodegenerative process.
Electron microscopy analysis of fibril preparations is the gold standard method, and the information provided here can be used for cross-study replication and standardization. However, there are some disadvantages of using this approach; electron microscopy can be cumbersome, non-quantitative, and incapable of determining concentrations of different α-synuclein species. Typical electron microscopy has a lower resolution limit (e.g., ~4 nm) and may skew towards the detection of one species and not another species. While we still use electron microscopy to calculate an average length of fibrils, it is important to note the strong heterogeneity of fibril lengths after sonication. Even our unsonicated preparations of fibrils that went through one freeze-thaw cycle and storage in the freezer showed a low concentration of small (<50 nm) fibrils. Dynamic light scattering profiles may be more meaningful for routine characterization of fibril preparations; they are easy to produce and provide a working measurement of concentration that allows for easier cross-study comparisons. Of note, uncontrolled local production of heat in the fibril solution during extensive sonication may cross-link protein conformers into aggregates and potentially stable oligomers that may be difficult to detect. We took care to carefully control temperature with rest times during sonication in chilled aluminum blocks to avoid the possibility of heat denaturing the protein.
The efficiency of fibril-induced inclusion formation depends on the abundance of endogenous α-syn expressed in the cell. α-Syn is an abundant protein with a concentration of 44 μM, or 0.16% of synaptosome protein, in preparations from rat brain (Wilhelm et al., 2014). Our calculation of the amount of α-syn in hippocampal primary neurons indicated that we rapidly exceeded the capability of the neuronal culture to form additional inclusions when exogenous α-syn concentrations exceeded the amount of endogenous α-syn expressed. For example, increasing by ten-fold the number of fibrils added in the picomolar range did not increase the number of inclusions formed. Thus, it seems reasonable to limit the amount of fibril seed with respect to the substrate available if on-target inclusion phenotypes are desired. This should be empirically determined in different model systems. In vivo, with both striatum and SNpc injections in C57BL/6J and rats, we likely did not achieve a ceiling effect since the most concentrated (29 nm) fibrils produced an increase in inclusion load compared to less concentrated and longer fibril preparations. However, we suspect a ceiling effect was observed in the C3H/HeJ strain where a large increase in the number of fibrils (~40-fold) injected failed to increase the inclusion burden. One of the original reports of the α-syn fibril model in mice used mixed strains on the C3H background (Luk et al., 2012). Interestingly, the C3H/HeJ mice are deficient in TLR4 expression and function (Poltorak et al., 1998), and TLR4 is a known receptor for aggregated α-syn (Fellner et al., 2013; Stefanova et al., 2011). Different than recent reports (Luk et al., 2016), we did not see an obvious difference between human versus mouse α-syn in templating inclusions in mouse primary neurons. A comparative analysis in vivo may be warranted, since both human and mouse α-syn fibrils are being used interchangeably depending on the study (Luk et al., 2016; Masuda-Suzukake et al., 2014; Masuda-Suzukake et al., 2013; Peelaerts et al., 2015; Sacino et al., 2014).
Our data suggest that application of fibrils to dopaminergic cell bodies can cause formation of inclusions within the soma. The inclusion formation process may be different depending on the type of cell involved (dopaminergic vs. glutamatergic) or where the fibril enters the neuron. For example, at the pre-synapse, a fibril seed may template a new inclusion using local pools of α-syn, and these new inclusions eventually spread back to the cell body. Alternatively, inclusions may form where the fibrils are taken up and the time course at which inclusion appears depends on the local concentration of α-syn monomer. However, α-syn fibrils can travel in both anterograde and retrograde directions, potentially complicating interpretation (Brahic et al., 2016). In either case, the result of fibril exposure at or away from the dopaminergic cell bodies unquestionably leads to the demise of many of the dopaminergic neurons after six months.
To appreciate the relationship between inclusion burden and dopaminergic neurodegeneration at a fixed time-point (i.e., six-months) when both neurodegeneration and inclusion load are present, we manipulated fibril concentrations applied to rats and mice to alter inclusion load and spread in the brain. Six months’ post-injection, the loss of TH expression appears to mirror the loss of Nissl-positive cells making the loss of TH expression without overt cell loss less likely (Paumier et al., 2015). As we did not observe neurodegeneration in any monomer-injected rodents, the α-syn protein itself, contaminating components in the solution, or the surgery procedure seems unlikely to cause either inclusion formation or the loss of TH+ cells. A major source of variability in the model may be due to the usage of different strains of animals that included outbred Sprague-Dawley (Taconic) rats, as well as technical variability associated with the injections. The identification of variables that may underlie susceptibility in the outbred rats to dopaminergic neurodegeneration may be important in understanding the disease model and therapeutic approaches.
In both rats and mice, inclusion spread away from the injection site correlated well with dopaminergic neurodegeneration. Thus, neurodegeneration must be considered as a critical co-variable in the interpretation of inclusion spread in these models. Because of the connectivity associated with the sites of injection in this study (striatum and SNpc), we could not easily distinguish between spread of the inclusions caused by uptake of the material we injected versus the possible spread of new fibrils particles from neuron to neuron. These are some of the most critical questions in defining conditions and differential vulnerability to prion-like transmission. Additionally, as mentioned, it is unclear whether different rates of fibril uptake and inclusion formation in different kinds of neurons could also mimic aspects of prion-like transmission in the context of neurodegeneration, and how analysis of different timepoints (e.g., pre-neurodegeneration) may predict cell loss in individual animals. We hope that our observations in this study will help guide the design and interpretation of future studies that help resolve the mechanisms of inclusion formation and provide novel routes for the prevention of neurotoxicity.
Methods
Generation of recombinant α-syn
Mouse and human α-syn, encoded in the inducible bacterial expression plasmid pRK172 and purified by maxi-prep (Qiagen), was transformed into chemically-competent BL21 (DE3) Codon Plus cells (Clontech). A single colony was selected for growth in terrific-broth (Fisher) supplemented with 100 μg mL−1 ampicillin (Sigma). Growth was monitored to log-phase, protein production induced by IPTG for 2 hours, 37°C, and pellets were collected at OD600 = 0.80. Bacterial pastes were weighed and ~5 g was combined with 25 mL of lysis buffer consisting of 750 mM NaCl, 10 mM Tris, pH 7.6, 1 mM EDTA, 1 mM PMSF, and 1× bacterial protease inhibitor cocktail (RPI). Homogenates were sonicated at 70% power (Fisher Model 500 Dismembrator) for 1 min 20 sec (5 seconds sonication pulses with 25 seconds of off time, on ice), and tubes placed in boiling water for 15 minutes. After ~15 minutes on ice, samples were centrifuged for 25 minutes at ~10,000 × g for 25 minutes at 4° C, twice. Supernatants were loaded into SnakeSkin dialysis tubing (3.5 kDa MWCO, Fisher) and placed into 4 L of ice-cold buffer (10 mM Tris, pH 7.6 with 50 mM NaCl, 1 mM EDTA, PMSF) with stirring overnight. Next, supernatants were centrifuged at 100,000 × g for 1 hour at 4 C, and supernatants concentrated to ~5 mL using Amicon Ultra15 3.5 MWCO columns. Concentrate was next passed through a HiLoad 16/600 Superdex Column, 1 × 120ml (GE Healthcare) with 10 mM Tris, pH 7.6 with 50 mM NaCl, 1 mM EDTA as running buffer. Fractions containing α-syn protein, as assessed by SDS-PAGE and Coomassie stain, were combined and loaded into SnakeSkin dialysis tubing (5 kDa MWCO, Fisher) and placed into 4 L of ice-cold buffer (10 mM Tris, pH 7.6 with 25 mM NaCl, 1 mM EDTA, PMSF) with stirring overnight. After dialysis the fractions were loaded at one time into a HiPrep Q HP 16/10 Column, 1 × 20 mL (GE Healthcare) with a loading buffer (10 mM Tris pH 7.6, 25mM NaCl, l mM EDTA, 1 mM PMSF) and eluted with a gradient application of high-salt buffer (10 mM Tris, 1M NaCl pH 7.6, 1 mM EDTA, 1 mM PMSF). Samples containing α-syn were identified by SDS-PAGE and Coomassie blot, and dialyzed into the same dialysis buffer (excluding PMSF and EDTA) and concentrated as before. Concentration of protein (monomer, undiluted) was determined by BCA assay (Pierce), purity assessed by SDS-PAGE and Coomassie blot. Endotoxin levels were determined using a Pierce LAL chromogenic endotoxin quantification kit. For primary neuron experiments, a maximum of 1.3 EU was added and for in vivo experiments, a maximum of 6.3 or 12.6 EU was injected (mice and rats, respectively).
Generation of fibrils, sonication, and biosafety procedures
Monomer protein was diluted to a 5 mg mL−1solution of mouse or human α-syn protein (buffered with 50 mM Tris, pH 7.5, and 150 mM KCl) were included in 1.5 mL polypropylene centrifuge tubes shaken at 700 R.P.M. in an Eppendorf thermomixer for seven days at 37°C. The solution becomes turbid (i.e., cloudy) during the incubation. The fibrils were then aliquoted and frozen in liquid nitrogen or at −80 C. Immediately before each experiment, fibrils were thawed and diluted in phosphate-buffered saline (pH 7.5) to the desired amount (if necessary), and a 1/8 inch probe tip was inserted to a few millimeters from the bottom of the tube, and 30% power (Fisher Scientific Sonic Dismembrator FB120110) was applied for the indicated time (from 15 sec to 240 sec) in 15 second intervals with 1 sonication pulse and 1 second wait. In between 15 second intervals, fibrils rested in a metal block at room temperature for 2 min to dissipate heat in the solution. Since sonication aerosolizes fibrils, all sonication steps were performed in a biosafety-level 2 cabinet with the operator wearing disposable wrist guards and double-gloved. For all procedures, monomer α-syn was kept on ice, and fibril α-syn preparations were kept at room temperature, each for up to 6 hours before discarding. Clean-up and inactivation of the fibrils on contaminated surfaces was accomplished using a 1% SDS solution as described (Bousset et al., 2016; Thomzig et al., 2014).
Biophysical measures
For circular dichroism, 0.1 mg mL−1 of monomer or fibril samples were loaded onto a photospectrometer cell with a 0.2 mm path length and scanned with the CD DSM-20 system (Olis), with a wavelength from 190 to 260 nm. For dynamic light scattering, estimated molecular weight of monomers and sonicated fibrils, 0.05 mg mL−1 of α-syn samples were measured with Titan DynaPro (Wyatt Technology) at 25°C. Data were collected and analyzed using the Dyna V6.3.4 software package, with the solvent (phosphate-buffer saline) background signal subtracted from each sample. Molecular weights of particles were estimated from intensity distributions. Thioflavin measurements with recorded in 100 μM preparations of monomer (1.4 mg mL−1), combined with the indicated amount of fibrils, together with 20 ng mL−1 of thioflavin T (Sigma), mixed in 20 μL reactions in 384 well plates. Plates were incubated at 37°C, shaken at 800rpm, and emission at 483 nm (440 nm excitation) was recorded at the indicated interval. For transmission electron microscopy, 3 μL of 0.1 mg mL−1 samples were applied to glow-discharged 400 mesh, carbon-only, copper grids (Electron Microscopy Sciences) and negatively stained with 1% uranyl acetate (Polysciences). The grids were imaged in a FEI Tecnai F20 electron microscope (Eindhoven) operated at 200 kV with nominal magnification at 65,000× and a defocus range of −1.0 μm to −1.27 μm. Images were collected on a Gatan Ultrascan 4000 CCD camera.
Animals
All animal protocols were approved by the University of Alabama at Birmingham Institutional Animal Care and Use Committee. C57BL/6J mice, C3H/HeJ, and timed-pregnant mice, and α-syn knockout mice (Strain 016123), were obtained from Jackson laboratories. Sprague Dawley outbred rats were obtained from Taconic Farms.
Primary neuron culture
At days 16–17 gestation in isoflurane-anesthetized mice, animals were sacrificed by cervical dislocation and embryos removed to ice. After a five-minute incubation on ice, brains were removed and hippocampi dissected into Hibernate E medium (BrainBits). Tissue was next digested with papain (Worthington Biochemical) in HBSS buffer supplemented with HEPES (10 mM, pH 7.4) and 100 mM sodium pyruvate with 1% penicillin/streptomycin (pen/strep, Invitrogen). Primary neurons were dissociated from tissue pieces into Neurobasal media (Gibco) supplemented with 1× B27 reagent (Gibco), 5 mM GlutaMAX (Gibco) and 10% fetal bovine serum (Invitrogen) and cells plated to poly-d-lysine (Sigma) coated surface at a density of 5 × 10⁴ cells per cm2. 2 hours later, media was replaced with Neurobasal media, containing only GlutaMAX and B27 supplement.
Intracranial injection and processing
Intracranial injections of α-syn fibrils or monomer control (equivalent protein weights, 10 μg or 20 μg per injection each for mouse and rat, respectively) were conducted in ~8–10 week old mice or rats anesthetized with vaporized isoflurane and dexdomitor on a gas mask fitted to a digital stereotaxic frame (David Kopf). Rodents were wrapped in an infrared core-warming stage with monitoring of pulse-oxygen and respiration (Kent Scientific PhysioSuite). Solutions for injection were drawn to a 32-gauge custom needle (Hamilton) with a 110° bevel fitted to a gas-tight syringe and controlled by a digital pump (Harvard Apparatus). The injection of 2 μL (mouse) or 4 μL (rat) occurred over the course of 20 minutes to prevent solution running back up the needle track. Solutions were injected into the right dorsal striatum in mice (and rats) at the following empirically derived coordinates: 1.0 (0.7 rat) mm anterior and 1.85 (3.0 rat) mm lateral to the Bregma, and 3.0 (5.5 rat) mm ventral relative to the skull, with the needle bevel facing laterally. Solutions were injected into the right SNpc at the following empirically derived coordinates: 3.1 (4.65 rat) mm posterior and 1.5 (2.25 rat) mm lateral to Bregma, and 4.6 (7.45 rat) mm ventral relative to skull, with the needle bevel facing laterally. Scalp incisions were closed by suture. Six months later, rodents were deeply anesthetized with isofluorane and transcardially perfused with PBS (pH 7.4) followed by freshly prepared 4% PFA buffered in PBS. Brains were removed, post-fixed for 24 hours in the 4% PFA and PBS solution, floated into 30% sucrose PBS solution for up to three days, and frozen in isopentane solution (−50°C) and stored at −80°C.
Immunofluorescence and Immunohistochemistry
Primary neurons were affixed in 4% paraformaldehyde (Electron Microscopy) with 4% sucrose for 1 hour at room temperature, and rinsed four-times with phosphate-buffered saline (PBS). A blocking buffer of 3% bovine-serum albumin (Sigma) with 0.1% Triton X-100 in PBS was applied for 1 hour at room temperature, and primary antibodies applied in the same buffer with pS129-α-syn (20 ng mL−1, clone 81A, IgG2a, Biolegend), NeuN (200 ng mL−1, Clone A60, IgG1, EMD Millipore) and Tau (1 μg mL−1, rabbit polyclonal, Dako), overnight at 4 °C. Neurons were rinsed and then a solution of secondary antibodies (Goat anti-IgG2a AlexaFluor 555 (4 μg mL−1), Goat anti-rabbit AlexaFluor 488 (4 μg mL−1), and Goat anti-IgG1 AlexaFluor 647 (4 μg mL−1) with Hoechst 33342 stain (10 μg mL−1) for 3 hours at room temperature. Coverslips were adhered with Prolong Gold (Invitrogen) mounting media.
Brain sections were cut to 40 μm on a freezing microtome and incubated in an antigen recovery solution of 10 mM sodium citrate, pH 6.0, supplemented with 0.05% tween, at 37 °C for 1 hour with gentle rocking. Sections were rinsed with tris-buffered saline (TBS, pH 7.4) and combined with blocking buffer (5% normal goat serum with 0.3% Triton X-100 in TBS). Sections were rinsed and combined with primary antibodies pS129-α-syn (20 ng mL−1, clone 81A, IgG2a, Biolegend), NeuN (200 ng mL−1, Clone A60, IgG1, EMD Millipore), tyrosine hydroxylase (400 ng mL−1, rabbit polyclonal, EMD Millipore), and choline acetyltransferase (1 μg mL−1, rabbit polyclonal, EMD Millipore) for 24 hours at 4° C with gentle rocking. Sections were rinsed and combined with secondary antibodies described above for 24 hours at 4 °C with gentle rocking. Sections were mounted to superfrost slides and mounted to coverslips with Prolong Gold (Invitrogen). Confocal microscopy was carried out with a Leica SP5 and imaging processing with LAS X software (Leica).
For immunohistochemistry with 3,3′-diaminobenzidine (DAB) and Nissl staining, brain sections were treated as above except for a quench for 30 min at room temperature with 0.3% H2O2 in methanol following antigen retrieval. Secondary antibodies (Jackson Immunologic), conjugated to biotin were used and sections treated with the ABC kit (Vector) followed by development with Impact DAB reagent (Vector). Sections were dehydrated progressively in ethanol and then Histo-Clear (national Diagnostics) and mounted to coverslips with Permount reagent (Fisher). Some sections were rehydrated with immersion to water and then treated with cresyl violet solution (0.1% cresyl violet, 0.08% acetic acid) for one-minute in a microwave, and then rinsed in water and dehydrated with ethanol, and immersed back into Histo-clear and mounted onto slides. Slides were analyzed on an Olympus BX61 wide field microscope.
Unbiased approaches, stereology, and statistics
Primary neurons were analyzed by triple-fluorescence microscopy on a Zeiss Cell Observer with an automated stage controlled by Zen 2.1 (Carl Zeiss) software. Grids for image acquisition were determined automatically and processed for signal related to tau and pS129-α-syn (238 μm frames), and NeuN (750 μm frames). Automatic measurements were recorded for the area of each condition occupied by a tau-positive process, the area within that process occupied by phosphorylated α-syn (α-syn/tau area ratio), and the total number of NeuN bodies detected within each image, and finally the number of phosphorylated α-syn bodies adjacent to NeuN bodies (i.e., soma inclusions). Signal for pS129-α-syn generated in parallel experiments from α-syn KO neurons was used to establish thresholds of background. Thousands of processes and features were collected for each condition reported in at least three independent experiments.
Unbiased stereological estimations of the total number of TH+ (Nissl counterstain) in the SNpc was performed using an optical fractionator probe (Stereologer software, Stereology Resource Center) by an investigator blinded to the experiment identity. A 4x objective was used to identify borders of the SNpc as a reference space, identified in part through Nissl contrast stain, at all midbrain levels. Sections used for counting covered the entire SNpc and were equally spaced 120 μm apart, with the frame placed randomly on the first counting area and systematically moved through all counting areas until the entire region was sampled. Guard zone height used was 2 μm to avoid artifacts on the cut surface of sections. Sampling grid size (e.g., 200 μm) was adjusted as needed, due to the heterogeneity of lesion size, to allow 1 to 5 objects on average counted at each of 100 to 200 x–y locations (minimum 100 objects counted for each observation, based on mean section thickness). Cells that were large (~30–50 μm) and Nissl+ but not TH positive within the borders of the SNpc were also counted (less than 1% of the total counts in each experimental group reported herein, consistent with past observations that α-syn fibril exposures do not suppress TH expression in cells that harbor inclusions (Volpicelli-Daley et al., 2016)). For counting soma inclusions through the SNpc or striatum, the rare-object counting probe was utilized. Only somatic perinuclear (e.g., adjacent to Nissl bodies) phosphorylated α-syn inclusions were counted because neuritic serpentine inclusions likely extended through multiple sections, with some facing perpendicular and nearly invisible to the cut surface, thereby invalidating stereological estimations.
A ranking based approach was also taken to estimate the amount of soma pathology in other brain areas that included the cortex, amygdala, and dorsal striatum. A score of 0 to 5 was assigned by a rater blinded to the experimental condition, with 0 representing no observable inclusions in any sections (e.g., Fig 5A), a score of 1 representing only a few neurons on average harboring inclusions per section (e.g., Fig 5B, Fig 6B2, Fig 8C2), a score of 2 to 3 with a mid-range load of inclusions (e.g., Fig 8A3 and Fig 8B3, respectively), and 4 to 5 representing sections with the highest amount of inclusions observed in any group (e.g., Fig 5D and Fig 6A3). Average scores for each animal were determined from 6–10 sections from each brain region.
Statistical analysis and graphs were performed and created with Graphpad Prism 5.0 software. Experimental groups were confirmed for normality using the Kolmogorov-Smirnov test and homogeneity of variances using Levene’s test. Two-tailed one-way ANOVA tests were used to calculate p values, where less than 0.05 was considered significant, and for those groups with significant differences, a post-hoc test (Tukey’s) was applied to each possible combination. Linear regression lines are shown for some plots, and Spearman correlation values were selected for analyzing ranked data.
Supplementary Material
Highlights.
Dynamic light-scattering profiles predict fibril induction of inclusions.
α-Synuclein fibrils induce inclusions in a complex non-linear fashion.
C3H/HeJ versus C57Bl/6J are more susceptible to fibril-induced inclusions.
Fibril-induced inclusion spread correlates with neurodegeneration.
Acknowledgments
This work was supported by the Michael J. Fox Foundation for Parkinson’s Disease research, NIH/NINDS grants R01 NS064934, P20 NS092530, R21 NS097643, and the American Parkinson’s Disease Association. We are grateful to Dr. Terje Dokland and Cynthia M. Rodenburg for assistance with the electron microscopy, which was carried out at the UAB Cryo-EM facility, Center for Structural Biology, University of Alabama at Birmingham. The authors are grateful to Altaira Dearborn, Rita Cowell, and Shaida Andrabi for critical review of the manuscript.
Footnotes
Publisher's Disclaimer: This is a PDF file of an unedited manuscript that has been accepted for publication. As a service to our customers we are providing this early version of the manuscript. The manuscript will undergo copyediting, typesetting, and review of the resulting proof before it is published in its final citable form. Please note that during the production process errors may be discovered which could affect the content, and all legal disclaimers that apply to the journal pertain.
References
- Ayers JI, et al. Robust Central Nervous System Pathology in Transgenic Mice following Peripheral Injection of alpha-Synuclein Fibrils. J Virol. 2017;91 doi: 10.1128/JVI.02095-16. [DOI] [PMC free article] [PubMed] [Google Scholar]
- Bousset L, et al. An Efficient Procedure for Removal and Inactivation of Alpha-Synuclein Assemblies from Laboratory Materials. J Parkinsons Dis. 2016;6:143–51. doi: 10.3233/JPD-150691. [DOI] [PMC free article] [PubMed] [Google Scholar]
- Brahic M, et al. Axonal transport and secretion of fibrillar forms of alpha-synuclein, Abeta42 peptide and HTTExon 1. Acta Neuropathol. 2016;131:539–48. doi: 10.1007/s00401-016-1538-0. [DOI] [PMC free article] [PubMed] [Google Scholar]
- Fellner L, et al. Toll-like receptor 4 is required for alpha-synuclein dependent activation of microglia and astroglia. Glia. 2013;61:349–60. doi: 10.1002/glia.22437. [DOI] [PMC free article] [PubMed] [Google Scholar]
- Fitzpatrick AW, et al. Nanomechanics and intermolecular forces of amyloid revealed by four-dimensional electron microscopy. Proc Natl Acad Sci U S A. 2015;112:3380–5. doi: 10.1073/pnas.1502214112. [DOI] [PMC free article] [PubMed] [Google Scholar]
- Knowles TP, Buehler MJ. Nanomechanics of functional and pathological amyloid materials. Nat Nanotechnol. 2011;6:469–79. doi: 10.1038/nnano.2011.102. [DOI] [PubMed] [Google Scholar]
- Luk KC, et al. Molecular and Biological Compatibility with Host Alpha-Synuclein Influences Fibril Pathogenicity. Cell Rep. 2016;16:3373–87. doi: 10.1016/j.celrep.2016.08.053. [DOI] [PMC free article] [PubMed] [Google Scholar]
- Luk KC, et al. Pathological alpha-synuclein transmission initiates Parkinson-like neurodegeneration in nontransgenic mice. Science. 2012;338:949–53. doi: 10.1126/science.1227157. [DOI] [PMC free article] [PubMed] [Google Scholar]
- Luk KC, et al. Exogenous alpha-synuclein fibrils seed the formation of Lewy body-like intracellular inclusions in cultured cells. Proc Natl Acad Sci U S A. 2009;106:20051–6. doi: 10.1073/pnas.0908005106. [DOI] [PMC free article] [PubMed] [Google Scholar]
- Masuda-Suzukake M, et al. Pathological alpha-synuclein propagates through neural networks. Acta Neuropathol Commun. 2014;2:88. doi: 10.1186/s40478-014-0088-8. [DOI] [PMC free article] [PubMed] [Google Scholar]
- Masuda-Suzukake M, et al. Prion-like spreading of pathological alpha-synuclein in brain. Brain. 2013;136:1128–38. doi: 10.1093/brain/awt037. [DOI] [PMC free article] [PubMed] [Google Scholar]
- McDonald AJ. Organization of amygdaloid projections to the prefrontal cortex and associated striatum in the rat. Neuroscience. 1991;44:1–14. doi: 10.1016/0306-4522(91)90247-l. [DOI] [PubMed] [Google Scholar]
- Osterberg VR, et al. Progressive aggregation of alpha-synuclein and selective degeneration of lewy inclusion-bearing neurons in a mouse model of parkinsonism. Cell Rep. 2015;10:1252–60. doi: 10.1016/j.celrep.2015.01.060. [DOI] [PMC free article] [PubMed] [Google Scholar]
- Paumier KL, et al. Intrastriatal injection of pre-formed mouse alpha-synuclein fibrils into rats triggers alpha-synuclein pathology and bilateral nigrostriatal degeneration. Neurobiol Dis. 2015;82:185–99. doi: 10.1016/j.nbd.2015.06.003. [DOI] [PMC free article] [PubMed] [Google Scholar]
- Peelaerts W, et al. alpha-Synuclein strains cause distinct synucleinopathies after local and systemic administration. Nature. 2015;522:340–4. doi: 10.1038/nature14547. [DOI] [PubMed] [Google Scholar]
- Poltorak A, et al. Defective LPS signaling in C3H/HeJ and C57BL/10ScCr mice: mutations in Tlr4 gene. Science. 1998;282:2085–8. doi: 10.1126/science.282.5396.2085. [DOI] [PubMed] [Google Scholar]
- Rey NL, et al. Widespread transneuronal propagation of alpha-synucleinopathy triggered in olfactory bulb mimics prodromal Parkinson’s disease. J Exp Med. 2016;213:1759–78. doi: 10.1084/jem.20160368. [DOI] [PMC free article] [PubMed] [Google Scholar]
- Sacino AN, et al. Amyloidogenic alpha-synuclein seeds do not invariably induce rapid, widespread pathology in mice. Acta Neuropathol. 2014;127:645–65. doi: 10.1007/s00401-014-1268-0. [DOI] [PMC free article] [PubMed] [Google Scholar]
- Serpell LC, et al. Fiber diffraction of synthetic alpha-synuclein filaments shows amyloid-like cross-beta conformation. Proc Natl Acad Sci U S A. 2000;97:4897–902. doi: 10.1073/pnas.97.9.4897. [DOI] [PMC free article] [PubMed] [Google Scholar]
- Spillantini MG, et al. Filamentous alpha-synuclein inclusions link multiple system atrophy with Parkinson’s disease and dementia with Lewy bodies. Neurosci Lett. 1998;251:205–8. doi: 10.1016/s0304-3940(98)00504-7. [DOI] [PubMed] [Google Scholar]
- Spillantini MG, et al. Alpha-synuclein in Lewy bodies. Nature. 1997;388:839–40. doi: 10.1038/42166. [DOI] [PubMed] [Google Scholar]
- Stefanova N, et al. Toll-like receptor 4 promotes alpha-synuclein clearance and survival of nigral dopaminergic neurons. Am J Pathol. 2011;179:954–63. doi: 10.1016/j.ajpath.2011.04.013. [DOI] [PMC free article] [PubMed] [Google Scholar]
- Surmeier DJ, et al. Selective neuronal vulnerability in Parkinson disease. Nat Rev Neurosci. 2017;18:101–113. doi: 10.1038/nrn.2016.178. [DOI] [PMC free article] [PubMed] [Google Scholar]
- Tarutani A, et al. The Effect of Fragmented Pathogenic alpha-Synuclein Seeds on Prion-like Propagation. J Biol Chem. 2016;291:18675–88. doi: 10.1074/jbc.M116.734707. [DOI] [PMC free article] [PubMed] [Google Scholar]
- Thomzig A, et al. Decontamination of medical devices from pathological amyloid-beta-, tau- and alpha-synuclein aggregates. Acta Neuropathol Commun. 2014;2:151. doi: 10.1186/s40478-014-0151-5. [DOI] [PMC free article] [PubMed] [Google Scholar]
- Volpicelli-Daley LA, et al. G2019S-LRRK2 Expression Augments alpha-Synuclein Sequestration into Inclusions in Neurons. J Neurosci. 2016;36:7415–27. doi: 10.1523/JNEUROSCI.3642-15.2016. [DOI] [PMC free article] [PubMed] [Google Scholar]
- Volpicelli-Daley LA, et al. Exogenous alpha-synuclein fibrils induce Lewy body pathology leading to synaptic dysfunction and neuron death. Neuron. 2011;72:57–71. doi: 10.1016/j.neuron.2011.08.033. [DOI] [PMC free article] [PubMed] [Google Scholar]
- Wilhelm BG, et al. Composition of isolated synaptic boutons reveals the amounts of vesicle trafficking proteins. Science. 2014;344:1023–8. doi: 10.1126/science.1252884. [DOI] [PubMed] [Google Scholar]
Associated Data
This section collects any data citations, data availability statements, or supplementary materials included in this article.