



Abstract
Purpose
To examine the change in size and location of pure geographic atrophy (GA).
Design
Population-based cohort study.
Methods
Ninety-five persons with GA at either baseline and/or one of the three 5-year follow-up examinations were identified. Using computer assisted software the lesion area and greatest linear dimension (GLD) were calculated. Thirty-two persons (53 multiple eye-visit pairs) were seen at multiple visits 5 years apart with GA in the same eye to evaluate changes in total area and GLD.
Results
At the first time pure GA was seen (n=95), 45% had a single GA lesion, 18% had “multifocal” GA lesions, and 37% had a “merged” GA lesion. Of 53 eyes with multiple visits, the overall increase in atrophy was 6.4 mm2 over a 5-year period. The atrophy progressed to involve the foveal center in 47% of eyes and there was a mean decrease of 17 letters read correctly. Eyes with multifocal GA were most likely to have the area of atrophy increase (mean=12 mm2) to have atrophy to progress to the foveal center (83%) and to have a decrease in vision (mean=22 letters) while eyes with a single GA lesion were least likely to have the area of atrophy increase (mean=2 mm2), progress to the foveal center (22%), and to have a decrease in vision (mean=10 letters).
Conclusions
These are the first population-based data describing the 5-year change in eyes with pure GA. Information on progression of GA will be useful for clinical trials of new interventions for GA.
Keywords: Age-related macular degeneration, geographic atrophy, progression
Introduction
Age-related macular degeneration (AMD) is an important cause of legal blindness in persons 65 years of age or older.1,2 Until recently, there have been few treatments for restoration of vision for the two end-stage AMD lesions, neovascular AMD and geographic atrophy (GA). Intravitreal anti-VEGF treatments have recently been shown to reverse visual loss in the eyes of some patients with neovascular AMD.3,4 However, no comparable treatment is available to prevent or reverse visual loss associated with the presence of pure GA. This is important because of the high 15-year cumulative incidence of GA (14%) in persons 43 to 86 years of age with signs of early AMD.5 In addition, persons 85 years of age or older have a 5-year incidence of pure GA (8%) that is about 4 times the incidence of neovascular AMD in people this age.5 In people 85 years of age or older, pure GA was found to be present in about 25% of eyes with a visual acuity of 20/200 or poorer (Klein R, unpublished data, 2008).
Population-based data show few ocular and medical factors related to the incidence of pure GA.5–18 There are even fewer data, almost all limited to selected clinical case series or histopathological studies, describing the natural history of pure GA once it is present.19–24 The natural history of pure GA has been described as progressive, going through stages, and usually involving loss of vision over time.21 The purposes of the current study are to examine: the characteristics of prevalent pure GA; change in the size of GA lesion(s); the relation of systemic risk factors to progression of GA; and the relation of pure GA at baseline to changes in visual acuity in the Beaver Dam Eye Study.
METHODS
Population
Methods used to identify and describe the population have appeared in detail in previous reports.2,25–28 In brief, a private census of the population of Beaver Dam, Wisconsin (99% white) was performed from fall 1987 to spring 1988.25 Of the 5,924 enumerated persons 43–84 years of age, 4926 participated in the baseline examination in 1988 to 1990. In the 3 follow-up examinations, 3722, 2962, and 2375 participated in the 5, 10, and 15-year follow-up examinations, respectively.2,26–28 After adjusting for age and gender, participants with pure GA at baseline were as likely to participate as those in whom AMD was absent (data not shown).
Procedures
Similar procedures were used at baseline and follow-up examinations.2,7,9,29–32 Informed signed consent was obtained at the beginning of each examination, Institutional Review Board approval was granted, and the study was conducted in accordance with Health Insurance Portability and Accountability Act regulations. Pertinent parts of the examination at both baseline and follow-up examinations consisted of measuring best corrected visual acuity using standardized protocols and taking stereoscopic 30° color fundus photographs centered on the disc (Diabetic Retinopathy Study [DRS] standard field 1) and macula (DRS standard field 2) and a non-stereoscopic color fundus photograph temporal to but including the fovea of each eye.2,29–32
At all the examinations, the refraction from a Humphrey 530 refractor was placed in a trial lens frame, and the best corrected visual acuity was measured for each eye using the Early Treatment Diabetic Retinopathy Study (ETDRS) protocol using charts R, 1, and 2 modified for a 2-meter distance.2 If the best corrected visual acuity was 20/40 or worse in either eye, an ETDRS refraction was performed for that eye and the visual acuity was measured. The visual acuity was recorded as the number of letters correctly identified from either the 2 m chart (from 20/10 to 20/200 vision or 70 to 5 letters) or the 1 m chart (20/250 to 20/800 or 0 to −25 letters). The 1 m chart has 25 letters; if all were read correctly, the number of letters assigned is 0; if none can be read correctly, the number of letters assigned is −25. For eyes with vision poorer than 20/800, 1 of 3 levels of vision was recorded: hand motions, light perception, and no light perception. These levels were assigned arbitrary values on the visual acuity scale of −40, −55, and −70, respectively.
The grading procedure for AMD and its lesions have been described in detail previously.31–33 In short, a circular grid was placed on one photographic slide of the stereoscopic pair which divided the macular area into nine subfields that consisted of a central circle (a single subfield), inner ring (comprised of the four inner subfields), and outer ring (comprised of four outer subfields). Eyes with pure GA were identified by light box grading and their location by subfield determined. To measure size and area of eyes with GA, all color fundus photographs of DRS Field 2 centered on the fovea with GA were scanned using a Nikon Coolscan 5000 ED (Nikon Inc., Melville, NY) at 2700 dpi and the images were imported into Digital Healthcare’s Oculab IP (Cambridge, England) for measurement. A tracing around the perimeter of each atrophic area was done using Digital Healthcare’s Oculab IP tools and the atrophic area and greatest linear dimension (GLD) were calculated (Figure 1a and 1b) by one grader (SMM). In eyes where multiple atrophic areas were present, the areas were added together and the GLD was determined using the largest atrophic area. If an atrophic area did not involve the fovea, a measurement was made from the fovea to the most proximal edge of the atrophy to determine the distance from the fovea. Intragrade interclass correlation (ICC) was excellent for total area of the atrophic lesion (ICC = 1.00) and for GLD (ICC = 0.99).
Figure 1.


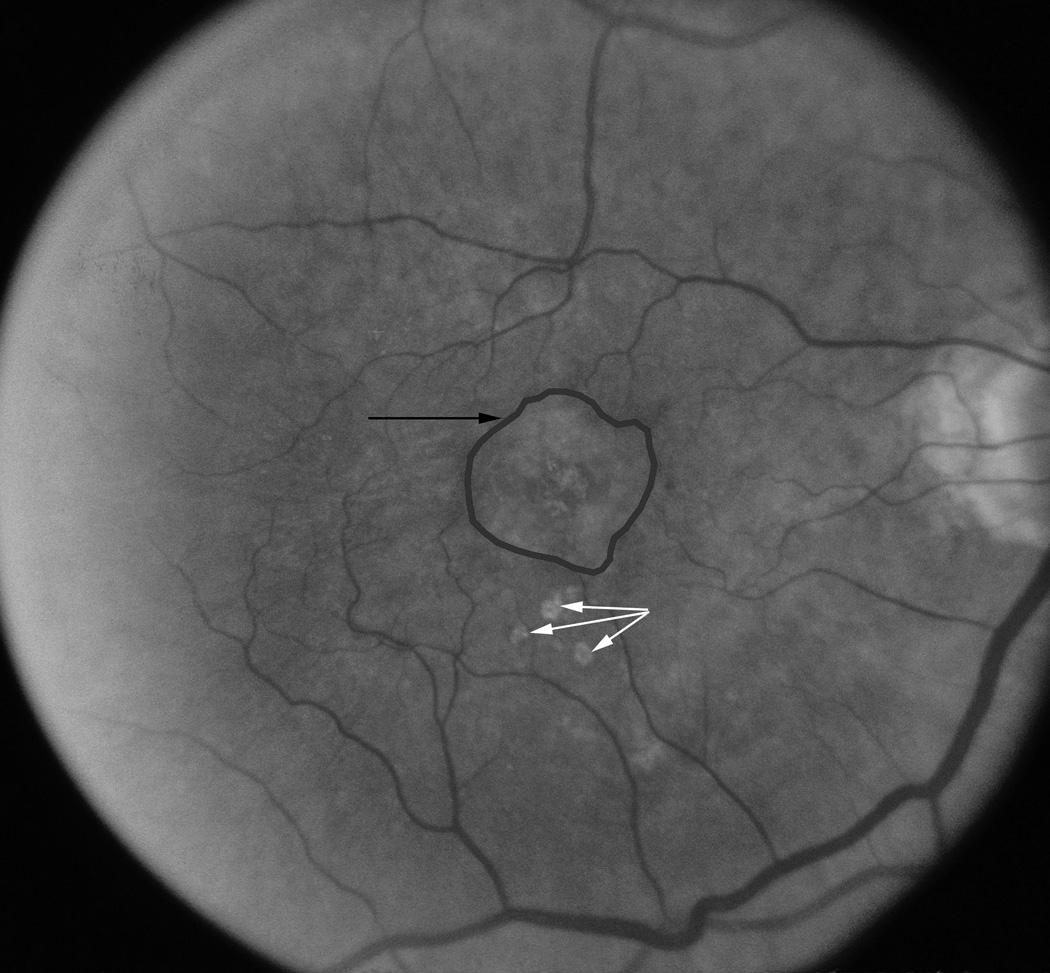
a–c. Examples of tracings around geographic atrophy perimeters made to obtain measurements for area and GLD. 1a) Fundus photograph showing 3 separate lesions or multifocal geographic atrophy in left eye at first visit in 1995; 1b) The same eye 4 ½ years later with the multifocal areas of geographic atrophy merging together into one large lesion; and 1c) an example of a classic single geographic atrophy lesion (black arrow) above 3 soft drusen (white arrows).
Pure GA lesions were classified into 3 configurations based on the number of atrophic areas and appearance of the atrophy in the fundus photographs. The first was “classic” and referred to a single usually round area of GA (Figure 1c). The second “multifocal” indicated two or more separate areas of GA (Figure 1a). The third, “merged”, indicated multifocal lesions have grown together into one or more larger irregular lesions, often with satellite areas of atrophy projecting off the main circular lesion (Figure 1b). For some analyses, classic single lesions were divided by size: “small” was defined as an atrophic lesion with a total area of 0.3 mm2 or less and “moderate to large” defined as an atrophic lesion with a total area of more than 0.3 mm2. Intragrader variation for identifying type of GA lesion was good (unweighted kappa score 0.84).
Definitions of Study Characteristics
For purposes of this report, the baseline examination refers to the examination where GA was first present. For example, a person who came in for the 1st examination with GA would have covariates at the 1st examination as the baseline, while a person who came in for the 3rd examination with GA and did not have GA at the previous examinations would have covariates at the 3rd examination as the baseline. Age was defined as the age at the time of the baseline examination. The mean systolic blood pressure was the average of the two systolic blood pressure determinations, and the mean diastolic blood pressure was the average of the two diastolic blood pressures at baseline. Hypertension was defined as a mean systolic blood pressure of ≥ 140 mmHg and/or a mean diastolic blood pressure of ≥ 90 mmHg and/or a history of using antihypertensive medication. Body mass index at baseline was defined as body weight in kilograms divided by the height in meters squared. A person was defined as having diabetes if he/she had a previous history of diabetes mellitus and was treated with insulin, oral hypoglycemic agents, and/or diet or was newly discovered to have diabetes at the examination.16 The definition of physical activity was based on the participant’s response to the question, “On average, how many times a week do you engage in a regular activity like brisk walking, jogging, bicycling, etc. long enough to work up a sweat?”. Persons reporting such activity less than 3 times/week were considered sedentary. Cigarette smoking status was determined as follows: a subject was classified as a non-smoker if he/she had smoked fewer than 100 cigarettes in his/her lifetime; as an ex-smoker if he/she had smoked more than this number of cigarettes in his/her lifetime but had stopped smoking before the examination; and as a current smoker if he/she had not stopped smoking. A heavy drinker was defined as a person consuming four or more servings of alcoholic beverages daily during any period of their life and a non-heavy drinker had never consumed four or more servings daily on a regular basis.
Statistical Methods
During the 4 examination phases, 184 eyes with GA were identified in 95 persons. Characteristics of the different GA types were compared using chi-squared tests for categorical variables (e.g., sex) and with F-tests for continuous factors (e.g., age). For simplicity, in the baseline comparisons, we restricted the dataset to the first time GA appeared in a person. If both the right eye and left eye had GA for the first time at the same examination, we used data for the right eye for comparisons.
The primary focus of this paper was to evaluate 5-year change in GA measures. A total of 53 eyes in 32 persons had at least 1 follow-up examination in which change in GA measures could be calculated. In order to control for multiple observations from the same person (e.g., right and left eye, 3 visits with the right eye), we used mixed effect models to parse out the different sources of variation. Specifically, the components of the variation included participant and the eye within a participant. The fixed effects were the various risk factors of interest. SAS version 9.1 (SAS Institute Inc., Cary, NC) was used for analyzing the data.
Results
Characteristics
When pure GA was first observed, 23% (22/95) of participants had bilateral GA without evidence of signs of exudative AMD, 27% (26/95) had signs of GA without exudative AMD in 1 eye and exudative AMD in the fellow eye, and 50% (47/95) had GA in 1 eye and no signs of AMD or only early AMD in the fellow eye. Of the 95 eyes with GA when first seen, the average total area was 4.6 mm2 (1.8 Disc Areas [DA]) and the average greatest linear dimension (GLD) of the largest lesion was 2,465 µm (Table 1). In 50% of eyes, the foveal center was involved. The mean number of letters read correctly after refraction on the LogMar visual acuity chart was 26 letters (20/80) (Table 1). Other characteristics of the cohort with GA when first seen are shown in Table 1.
Table 1.
Characteristics When Geographic Atrophy (GA) First Seen in Beaver Dam Eye Study.
| GA in at Least 1 Eye | Classic Single | Multifocal | Merged | |||||||
|---|---|---|---|---|---|---|---|---|---|---|
| Characteristic | N | Mean (SD) or % | N | Mean (SD) or % | N | Mean (SD) or % | N | Mean (SD) or % | P-valuec | |
| Age | Years | 95 | 80.8 (7.4) | 43 | 78.9 (8.8) | 17 | 81.3 (5.5) | 35 | 82.9 (5.7) | .06 |
| Sex | Women | 62 | 65.3 | 27 | 62.8 | 11 | 64.7 | 24 | 68.6 | .87 |
| Men | 33 | 34.7 | 16 | 37.2 | 6 | 35.3 | 11 | 31.4 | ||
| Systolic blood pressure | mmHg | 90 | 138.5 (22.9) | 40 | 135.6 (20.4) | 16 | 135.6 (22.0) | 34 | 143.1 (25.8) | .32 |
| Diastolic blood pressure | mmHg | 90 | 70.7 (12.4) | 40 | 70.2 (12.7) | 16 | 70.9 (7.8) | 34 | 71.0 (13.8) | .96 |
| Body mass index | kg/m2 | 90 | 28.4 (6.1) | 41 | 27.8 (5.8) | 16 | 27.8 (5.6) | 33 | 29.4 (6.7) | .49 |
| Diabetes | No | 76 | 89.4 | 35 | 92.1 | 15 | 93.8 | 26 | 83.9 | .45 |
| Yes | 9 | 10.6 | 3 | 7.9 | 1 | 6.3 | 5 | 16.1 | ||
| Hypertension | No | 29 | 31.5 | 18 | 43.9 | 4 | 25.0 | 7 | 20.0 | .07 |
| Yes | 63 | 68.5 | 23 | 56.1 | 12 | 75.0 | 28 | 80.0 | ||
| Smoking history | Never | 54 | 57.4 | 25 | 59.5 | 7 | 41.2 | 22 | 62.9 | .56 |
| Past | 36 | 38.3 | 16 | 38.1 | 9 | 52.9 | 11 | 31.4 | ||
| Current | 4 | 4.3 | 1 | 2.4 | 1 | 5.9 | 2 | 5.7 | ||
| Heavy drinking history | Never | 83 | 88.3 | 39 | 92.9 | 14 | 82.4 | 30 | 85.7 | .41 |
| Past | 9 | 9.6 | 2 | 4.8 | 2 | 11.8 | 5 | 14.3 | ||
| Current | 2 | 2.1 | 1 | 2.4 | 1 | 5.9 | 0 | 0.0 | ||
| Sedentary lifestyle | No | 11 | 11.8 | 5 | 12.2 | 4 | 23.5 | 2 | 5.7 | .18 |
| Yes | 82 | 88.2 | 36 | 87.8 | 13 | 76.5 | 33 | 94.3 | ||
| Total areaa | mm2 | 95 | 4.62 (6.00) | 43 | 2.72 (4.54) | 17 | 2.02 (1.91) | 35 | 8.21 (7.14) | <.001 |
| Total disc areaa,b | 95 | 1.8 (2.4) | 43 | 1.1 (1.8) | 17 | 0.7 (0.6) | 35 | 3.4 (2.8) | <.001 | |
| GLDa | µm | 95 | 2465 (1841) | 43 | 1608 (1462) | 17 | 1520 (886) | 35 | 3977 (1621) | <.001 |
| Center pointa | No | 48 | 50.5 | 21 | 48.8 | 14 | 82.4 | 13 | 37.1 | .009 |
| Yes | 47 | 49.5 | 22 | 51.2 | 3 | 17.6 | 22 | 62.9 | ||
| Visual acuitya | # letters | 88 | 25.7 (31.0) | 39 | 29.2 (29.6) | 16 | 32.9 (27.6) | 33 | 18.1 (33.3) | .19 |
using first visit geographic atrophy was present; if both eyes present, used right eye only
test for difference amongst 3 geographic atrophy types (chi-square test for categorical factors and F-test for continuous factors)
Of the persons with pure GA in at least one eye when first seen, 43 (45%) had a classic single atrophic lesion, 17 (18%) had multifocal atrophic lesions, and 35 (37%) had merged atrophic lesions. Comparisons of characteristics in persons when first seen by type of lesion appear in Table 1. GA eyes with merged atrophic lesions had the largest area of atrophy and had the poorest vision while GA eyes with multifocal atrophic lesions had the smallest area of atrophy and the best visual acuity. Merged lesions were most likely to involve the foveal center. Otherwise, there were few differences in age and other characteristics among persons with different types of GA lesions (Table 1).
Progression of Pure GA
Changes in total area and GLD were measured in a total of 32 persons (53 multiple eye-visit pairs) who were seen at multiple visits 5-years apart with GA in the same eye. Of the 53 observations, all had progression of atrophy. Figure 2 shows a scatterplot of the change in the area of atrophy by the baseline area. On average, area of atrophy increased by 6.4 mm2 (2.5 disc areas, Table 2). Figure 3 shows a scatterplot of the change in vision by the baseline vision. On average, vision decreased by 17 letters read correctly (Table 2).
Figure 2.

Relation in change in area of geographic atrophy over a 5 year period by baseline total area of atrophy in 53 observations of which 41 eyes in 32 persons are represented for 2 or more follow-up visits.
Table 2.
Five Year Changes in Geographic Atrophy Measures by Type of Lesions.
| All Eyes | Classic Single | Multi-Focal | Merged | ||||||
|---|---|---|---|---|---|---|---|---|---|
| N | Mean (SE)a or % | N | Mean (SE)a or % | N | Mean (SE)a or % | N | Mean (SE)a or % | P-valueb | |
| Change in total area (mm2) | 53 | 6.35 (1.01) | 19 | 2.24 (1.19) | 7 | 11.97 (1.69) | 27 | 8.42 (1.02) | .001 |
| Change in disc areas | 53 | 2.45 (0.41) | 19 | 0.82 (0.49) | 7 | 4.66 (0.71) | 27 | 3.27 (0.42) | .002 |
| Change in GLD (µm) | 53 | 1434 (225) | 19 | 710 (232) | 7 | 3822 (353) | 27 | 1414 (198) | <.001 |
| Change in VA (# of letters) | 50 | −16.69 (3.26) | 17 | −10.47 (5.26) | 7 | −21.67 (7.98) | 26 | −19.74 (4.29) | .36 |
| Progression to center point | 19 | 47.4% | 9 | 22.2% | 6 | 83.3% | 4 | 50.0% | .08 |
N= number of eyes with change data, numbers differ due to missing data
Standard errors corrected for multiple observations within the same person (see Methods)
P-value is type 3 test from the mixed effect models for continuous measures and Fisher’s exact test for progression to the center point; p-values test for difference amongst the 3 geographic atrophy types
Abbreviations: SE=standard error; GLD= greatest linear dimension; VA=visual acuity
Figure 3.

Relation in change in number of letters read correctly over a 5 year period by baseline number of letters read correctly in 50 observations of which 38 eyes in 29 persons are represented for 2 or more follow-up visits when geographic atrophy was present at baseline and follow-up.
Of the 9 eyes with small classic single GA when first seen, at follow-up, 2 were classified as small classic, 3 as moderate to large classic GA, 3 as multifocal, and 1 as merged GA. Of the 10 eyes classified as moderate to large classic single when first seen, 8 remained as such, 1 was classified as multifocal GA and 1 as merged GA. Of the 7 classified as multifocal GA when first seen, all remained as such at follow-up. Of the 27 classified as merged GA when first seen, all remained as such.
Progression of pure GA by type of lesion and its relation to change in visual acuity is presented in Table 2. The mean increase of area of atrophy was greatest in eyes with multifocal lesions and least in eyes with single atrophic lesions. Eyes with multifocal or merged atrophic lesions were more likely to have decreased in letters read correctly than eyes with classic single lesions. They were also more likely to have had progression to involve the foveal center than eyes with a single lesion. Area of increase in atrophy (9.8 mm2 vs 3.6 mm2, P < .001) and GLD (1951 µm vs 1053 µm, P = .05) were greater if the contra lateral eye was involved with GA than if it was not. Change in the area of atrophy or number of letters read correctly was not related to foveal center involvement, distance of GA atrophy from foveal center, area of GA, or GLD at baseline (data not shown).
Age, sex, blood pressure, smoking and heavy drinking status, body mass index, and sedentary lifestyle were not related to increase in area of atrophy or GLD (data not shown).
Of the eyes with GA when first seen, 10.9% (6/55) progressed to neovascular AMD. This was most frequent when neovascular AMD was present in the fellow eye (50%, 3/6) and less frequent when early or no AMD was in the fellow eye (8.0%, 2/25) or when GA was in the other eye (4.1%, 1/24).
Concordance of GA
Across all examinations, there was bilateral involvement with pure GA in 42 right-left eye pairs (31 persons). Pearson correlation coefficients between eyes were 0.87 and 0.75 for total area and GLD, respectively. There were 12 instances where both the right and left eye had 5-year change data. The correlation coefficients between eyes were 0.85 and 0.83 for increase in area of atrophy and increase in GLD, respectively.
Discussion
Using computer-assisted measurements of digitized images of the macula in eyes with pure GA, we found a large amount of progression of atrophy (on average 6.4 mm2) and GLD (on average 1,434 µm) over 5-year periods of observation in the Beaver Dam Eye Study population. Increase in atrophy varied by lesion type at first observation. Eyes with multifocal atrophic lesions were most likely to have an increase in atrophy (12.0 mm2) and those with classic single lesions least likely to increase in atrophy (2.2 mm2). In addition, we report an average of 3 lines of vision lost.
To our knowledge, there are no other published population-based data available compare these findings with. Data from a clinic-based, prospective natural history study by Sunness et al. measured the enlargement rate of atrophy in 131 patients (212 eyes) 70 to 89 years of age with GA at baseline.21 They showed a mean enlargement rate of 2.6 mm2/year that was greater in eyes with larger compared to smaller areas of GA at baseline. In another study of 114 patients with GA, increase in the atrophy measured using autofluorescent imaging over a median follow-up time of 1.9 years was 1.8 mm2/year.22 In Beaver Dam, if the assumption is made of a linear relationship of increase in area of atrophy over time, our estimates of 1.3 mm2/year (varying from 0.4 mm2/year to 2.4 mm2/year depending on type of lesion) enlargement of atrophy for lesions is comparable with findings from these earlier studies. Comparisons of rates of increase in area of atrophy among studies must be done with care due to differences in methods of measurement of lesions, distributions of types and characteristics of GA lesions among subjects at baseline and that the assumption of linearity of an increase in area of GA over time may not be correct. For example, one might expect a lower rate of increase in area of atrophy in the Beaver Dam cohort because there were fewer persons with bilateral GA, a factor associated with rate of progression of atrophy, when GA was first found. In addition, it is more likely for a patient with GA and decreased vision in both eyes to be seen at a retinal specialty clinic than a person with small areas of GA in a single eye without decreased vision. Thus, the observations reported herein are generalizable to persons in the population with GA and contribute further to understanding of the natural history of this disease.
Previous clinical and histopathological observations have described the natural history of GA by type and location19,21,34 The study by Sunness et al. showed an evolution in stages from small, multifocal, horseshoe, ring, and solid stages.21 We limited our classification to 3 types of GA, and while all of the lesions grew larger, few changed type over 5-years of follow-up except for the small classic single GA. There were too few eyes with more than 2 follow-up periods to describe the long term evolution of these lesions in Beaver Dam. It is likely that newer classifications using scanning laser ophthalmoscopy to define the health of the retinal pigment epithelium (RPE) will further define the natural history of GA.
We found no systemic factors associated with increase in atrophy. This is consistent with findings of Dreyhaupt et al. in a clinic-based longitudinal study in 178 eyes of 114 patients.22 Sunness et al. also did not find a relation of hypertension or smoking status with rate of increase in atrophy in persons with GA.21 This is not unexpected, because, besides age and smoking, few systemic and environmental factors have been consistently shown to be related to the incidence of GA.15,16 In our study, the small numbers likely diminished the power to find a relationship of risk factors to the progression of atrophy.
While there are many strengths of our study, conclusions regarding estimates of progression of GA and associations described herein must be made with caution. Misclassification may have resulted from not identifying subtle signs of GA that might have been detected by measurement of hypoautoflurescence using a scanning laser ophthalmoscope. In addition, some eyes with GA when first seen may have been secondary to a collapsed RPE serous detachment associated with exudative AMD prior to the time the participant was first seen. The latter may progress differently compared to eyes in which GA occurs following fading of soft drusen and RPE depigmentation without neovascular AMD. It is also possible that persons with GA that were more rapidly progressing were more likely to die and not be seen at a 5-year follow-up compared to persons with eyes with slower progression, resulting in an underestimate of the amount of progression of GA. Chance, sample size, unadjusted confounding, and bias must be considered when interpreting our findings regarding associations of progression of GA with risk factors reported herein.
In summary, these data show that once present, GA is a progressive disease that results in loss of vision. Few systemic characteristics were found that predict increased risk of progression of GA. Inclusion of genetic factors and use of newer technologies that are more sensitive in detecting and measuring atrophy and preatrophy lesions may enable better characterization of GA lesions and of risk of progression. This will be important as new therapeutic interventions are developed for preventing visual loss in eyes with GA.
ACKNOWLEDGMENTS
A. FUNDING/SUPPORT
The National Eye Institute provided funding for entire study including collection and analyses and of data (Grant No. EY06594; R Klein, BEK Klein); Research to Prevent Blindness provided further additional support for data analyses (R. Klein, BEK Klein, Senior Scientific Investigator Awards, New York, NY).
B. FINANCIAL DISCLOSURES
RK served as a consultant to Pfizer Co. None--SM, MK, BK
C. CONTRIBUTIONS OF AUTHORS
Conception and design of the study, data collection and management, and obtained funding and provided resources (RK, BK); analysis and interpretation of data (RK, SM, MK, BK); critical revision and final approval of manuscript (RK, SM, MK, BK); statistical expertise (MK); manuscript preparation and literature search (RK).
D. CONFORMITY WITH AUTHOR INFORMATION
Written informed consent for the use and disclosure of protected health information was obtained from all subjects before being enrolled in the study and Institutional Review Board approval was granted by the Health Sciences Institutional Review Board at the University of Wisconsin, Madison.
Biography

Dr. Ronald Klein is a Professor of Ophthalmology and Visual Sciences at the University of Wisconsin School of Medicine and Public Health and is interested in ocular epidemiology of age-related eye disease and hypertensive and diabetic retinopathy.
Footnotes
Publisher's Disclaimer: This is a PDF file of an unedited manuscript that has been accepted for publication. As a service to our customers we are providing this early version of the manuscript. The manuscript will undergo copyediting, typesetting, and review of the resulting proof before it is published in its final citable form. Please note that during the production process errors may be discovered which could affect the content, and all legal disclaimers that apply to the journal pertain.
References
- 1.Congdon N, O'Colmain B, Klaver CC, et al. Causes and prevalence of visual impairment among adults in the United States. Arch Ophthalmol. 2004;122:477–485. doi: 10.1001/archopht.122.4.477. [DOI] [PubMed] [Google Scholar]
- 2.Klein R, Klein BE, Lee KE, Cruickshanks KJ, Gangnon RE. Changes in visual acuity in a population over a 15-year period: the Beaver Dam Eye Study. Am J Ophthalmol. 2006;142:539–549. doi: 10.1016/j.ajo.2006.06.015. [DOI] [PubMed] [Google Scholar]
- 3.Chang TS, Bressler NM, Fine JT, Dolan CM, Ward J, Klesert TR. Improved vision-related function after ranibizumab treatment of neovascular age-related macular degeneration: results of a randomized clinical trial. Arch Ophthalmol. 2007;125:1460–1469. doi: 10.1001/archopht.125.11.1460. [DOI] [PubMed] [Google Scholar]
- 4.Kaiser PK, Brown DM, Zhang K, et al. Ranibizumab for predominantly classic neovascular age-related macular degeneration: subgroup analysis of first-year ANCHOR results. Am J Ophthalmol. 2007;144:850–857. doi: 10.1016/j.ajo.2007.08.012. [DOI] [PubMed] [Google Scholar]
- 5.Klein R, Klein BE, Knudtson MD, Meuer SM, Swift M, Gangnon RE. Fifteen-year cumulative incidence of age-related macular degeneration: the Beaver Dam Eye Study. Ophthalmology. 2007;114:253–262. doi: 10.1016/j.ophtha.2006.10.040. [DOI] [PubMed] [Google Scholar]
- 6.Bressler NM, Munoz B, Maguire MG, et al. Five-year incidence and disappearance of drusen and retinal pigment epithelial abnormalities. Waterman study. Arch Ophthalmol. 1995;113:301–308. doi: 10.1001/archopht.1995.01100030055022. [DOI] [PubMed] [Google Scholar]
- 7.Klein R, Klein BE, Jensen SC, Meuer SM. The five-year incidence and progression of age-related maculopathy: the Beaver Dam Eye Study. Ophthalmology. 1997;104:7–21. doi: 10.1016/s0161-6420(97)30368-6. [DOI] [PubMed] [Google Scholar]
- 8.Klaver CC, Assink JJ, van Leeuwen R, et al. Incidence and progression rates of age-related maculopathy: the Rotterdam Study. Invest Ophthalmol Vis Sci. 2001;42:2237–2241. [PubMed] [Google Scholar]
- 9.Klein R, Klein BE, Tomany SC, Meuer SM, Huang GH. Ten-year incidence and progression of age-related maculopathy: The Beaver Dam Eye Study. Ophthalmology. 2002;109:1767–1779. doi: 10.1016/s0161-6420(02)01146-6. [DOI] [PubMed] [Google Scholar]
- 10.van Leeuwen R, Klaver CC, Vingerling JR, Hofman A, de Jong PT. The risk and natural course of age-related maculopathy: follow-up at 6 1/2 years in the Rotterdam study. Arch Ophthalmol. 2003;121:519–526. doi: 10.1001/archopht.121.4.519. [DOI] [PubMed] [Google Scholar]
- 11.Mitchell P, Wang JJ, Foran S, Smith W. Five-year incidence of age-related maculopathy lesions: the Blue Mountains Eye Study. Ophthalmology. 2002;109:1092–1097. doi: 10.1016/s0161-6420(02)01055-2. [DOI] [PubMed] [Google Scholar]
- 12.Wang JJ, Foran S, Smith W, Mitchell P. Risk of age-related macular degeneration in eyes with macular drusen or hyperpigmentation: the Blue Mountains Eye Study cohort. Arch Ophthalmol. 2003;121:658–663. doi: 10.1001/archopht.121.5.658. [DOI] [PubMed] [Google Scholar]
- 13.Sparrow JM, Dickinson AJ, Duke AM, Thompson JR, Gibson JM, Rosenthal AR. Seven year follow-up of age-related maculopathy in an elderly British population. Eye. 1997;11(Pt 3):315–324. doi: 10.1038/eye.1997.67. [DOI] [PubMed] [Google Scholar]
- 14.Buch H, Nielsen NV, Vinding T, Jensen GB, Prause JU, la Cour M. 14-year incidence, progression, and visual morbidity of age-related maculopathy: the Copenhagen City Eye Study. Ophthalmology. 2005;112:787–798. doi: 10.1016/j.ophtha.2004.11.040. [DOI] [PubMed] [Google Scholar]
- 15.Smith W, Assink J, Klein R, et al. Risk factors for age-related macular degeneration: Pooled findings from three continents. Ophthalmology. 2001;108:697–704. doi: 10.1016/s0161-6420(00)00580-7. [DOI] [PubMed] [Google Scholar]
- 16.Tomany SC, Wang JJ, van Leeuwen R, et al. Risk factors for incident age-related macular degeneration: pooled findings from 3 continents. Ophthalmology. 2004;111:1280–1287. doi: 10.1016/j.ophtha.2003.11.010. [DOI] [PubMed] [Google Scholar]
- 17.van Leeuwen R, Ikram MK, Vingerling JR, Witteman JC, Hofman A, de Jong PT. Blood pressure, atherosclerosis, and the incidence of age-related maculopathy: the Rotterdam Study. Invest Ophthalmol Vis Sci. 2003;44:3771–3777. doi: 10.1167/iovs.03-0121. [DOI] [PubMed] [Google Scholar]
- 18.Klein R, Klein BE, Tomany SC, Cruickshanks KJ. The association of cardiovascular disease with the long-term incidence of age-related maculopathy: the Beaver Dam Eye Study. Ophthalmology. 2003;110:1273–1280. doi: 10.1016/S0161-6420(03)00599-2. [DOI] [PubMed] [Google Scholar]
- 19.Sarks JP, Sarks SH, Killingsworth MC. Evolution of geographic atrophy of the retinal pigment epithelium. Eye. 1988;2(Pt 5):552–577. doi: 10.1038/eye.1988.106. [DOI] [PubMed] [Google Scholar]
- 20.Schatz H, McDonald HR. Atrophic macular degeneration. Rate of spread of geographic atrophy and visual loss. Ophthalmology. 1989;96:1541–1551. doi: 10.1016/s0161-6420(89)32694-7. [DOI] [PubMed] [Google Scholar]
- 21.Sunness JS, Gonzalez-Baron J, Applegate CA, et al. Enlargement of atrophy and visual acuity loss in the geographic atrophy form of age-related macular degeneration. Ophthalmology. 1999;106:1768–1779. doi: 10.1016/S0161-6420(99)90340-8. [DOI] [PubMed] [Google Scholar]
- 22.Dreyhaupt J, Mansmann U, Pritsch M, Dolar-Szczasny J, Bindewald A, Holz FG. Modelling the natural history of geographic atrophy in patients with age-related macular degeneration. Ophthalmic Epidemiol. 2005;12:353–362. doi: 10.1080/09286580591005723. [DOI] [PubMed] [Google Scholar]
- 23.Holz FG, Bindewald-Wittich A, Fleckenstein M, Dreyhaupt J, Scholl HP, Schmitz-Valckenberg S. Progression of geographic atrophy and impact of fundus autofluorescence patterns in age-related macular degeneration. Am J Ophthalmol. 2007;143:463–472. doi: 10.1016/j.ajo.2006.11.041. [DOI] [PubMed] [Google Scholar]
- 24.Sunness JS, Margalit E, Srikumaran D, et al. The long-term natural history of geographic atrophy from age-related macular degeneration: enlargement of atrophy and implications for interventional clinical trials. Ophthalmology. 2007;114:271–277. doi: 10.1016/j.ophtha.2006.09.016. [DOI] [PMC free article] [PubMed] [Google Scholar]
- 25.Linton KL, Klein BE, Klein R. The validity of self-reported and surrogate-reported cataract and age-related macular degeneration in the Beaver Dam Eye Study. Am J Epidemiol. 1991;134:1438–1446. doi: 10.1093/oxfordjournals.aje.a116049. [DOI] [PubMed] [Google Scholar]
- 26.Klein R, Klein BE, Linton KL, De Mets DL. The Beaver Dam Eye Study: visual acuity. Ophthalmology. 1991;98:1310–1315. doi: 10.1016/s0161-6420(91)32137-7. [DOI] [PubMed] [Google Scholar]
- 27.Klein R, Klein BE, Lee KE. Changes in visual acuity in a population. The Beaver Dam Eye Study. Ophthalmology. 1996;103:1169–1178. doi: 10.1016/s0161-6420(96)30526-5. [DOI] [PubMed] [Google Scholar]
- 28.Klein R, Klein BE, Lee KE, Cruickshanks KJ, Chappell RJ. Changes in visual acuity in a population over a 10-year period : The Beaver Dam Eye Study. Ophthalmology. 2001;108:1757–1766. doi: 10.1016/s0161-6420(01)00769-2. [DOI] [PubMed] [Google Scholar]
- 29.Klein R, Klein BE. Manual of Operations. Springfield, VA: US Department of Commerce; 1991. The Beaver Dam Eye Study; pp. 74–112. NTIS Accession No. PB91-149823. [Google Scholar]
- 30.Klein R, Klein BE. Manual of Operations. Springfield, VA: US Department of Commerce; 1995. The Beaver Dam Eye Study II; pp. 61–90. NTIS Accession No. PB95-273827. [Google Scholar]
- 31.Klein R, Davis MD, Magli YL, Segal P, Klein BE, Hubbard L. The Wisconsin Age-Related Maculopathy Grading System. Ophthalmology. 1991;98:1128–1134. doi: 10.1016/s0161-6420(91)32186-9. [DOI] [PubMed] [Google Scholar]
- 32.Klein R, Davis MD, Magli YL, Segal P, Klein BE, Hubbard L. The Wisconsin Age-Related Maculopathy Grading System. Springfield,VA: US Department of Commerce; 1991. NTIS Accession No. PB91-184267. [DOI] [PubMed] [Google Scholar]
- 33.Klein R, Klein BE, Linton KL. Prevalence of age-related maculopathy. The Beaver Dam Eye Study. Ophthalmology. 1992;99:933–943. doi: 10.1016/s0161-6420(92)31871-8. [DOI] [PubMed] [Google Scholar]
- 34.Maguire P, Vine AK. Geographic atrophy of the retinal pigment epithelium. Am J Ophthalmol. 1986;102:621–625. doi: 10.1016/0002-9394(86)90535-0. [DOI] [PubMed] [Google Scholar]