



Abstract
The responses of marmoset lateral geniculate neurones to stimuli that were composed of a sinusoidally modulating centre stimulus and a surround that was modulated in counterphase were measured. The size of the stimulus centre was varied. These measurements were repeated at different temporal frequencies between 1 and 30 Hz. The response amplitudes and phases depended in a characteristic manner on the stimulus centre size. The response behaviour could be modelled by assuming Gaussian responsivity profiles of the cells' receptive field (RF) centres and surrounds and a phase delay in the RF surround responses, relative to the centre, enabling the description of RF centre and surround response characteristics. We found that the RF centre-to-surround phase difference increased linearly with increasing temporal frequency, indicating a constant delay difference of about 4.5 to 6 ms. A linear model, including low-pass filters, a lead lag stage and a delay, was used to describe the mean RF centre and surround responses. The separate RF centre and surround responses were less band pass than the full receptive field responses of the cells. The linear model provided less satisfactory fits to M-cell responses than to those of P-cells, indicating additional nonlinearities.
The receptive fields (RFs) of retinal ganglion cells and neurones in the lateral geniculate nucleus (LGN) have a centre and a surround region (Kuffler, 1953). The surrounds are spatially equally large or larger and generally less responsive than the centres. At low temporal frequencies, centres and surrounds are antagonistic. In trichromatic macaques the response phases of the centre and surround differ in parvocellular (P) cells. The phase difference increases linearly with temporal frequency, suggesting a response delay difference between the centre and the surround (Lee et al. 1989; Smith et al. 1992). This has also been found in cat X-cells (Enroth-Cugell et al. 1983; Dawis et al. 1984; Frishman et al. 1987). The centre and surround responses of the macaque retinal ganglion cells and LGN cells belonging to the parvocellular channel were measured by using spatially homogenous stimuli with different chromatic contrasts, thereby changing the relative centre and surround contributions to the overall response of the cell. The frequency-doubled responses to the chromatic contents in the stimuli prohibited a similar analysis for magnocellular (M) cells, so that the centre-to-surround phase difference for M-cells has not been described yet. Neither are any data about the centre and the surround response phases of koniocellular (K) cells available.
The temporal properties of full RFs of cells in the primate LGN and retina have been thoroughly described (Derrington & Lennie, 1984; Lee et al. 1989, 1990, 1994; Purpura et al. 1990; Benardete et al. 1992; Yeh et al. 1995a; Lee, 1996; Kremers et al. 1997; Kremers & Lee, 1998; Solomon et al. 1999; Benardete & Kaplan, 1999). A separate description of the spatio-temporal response characteristics of the RF centre and surround is given for monkey retinal ganglion cells belonging to the P-pathway (Benardete & Kaplan, 1997) but not for those belonging to the M-pathway. Furthermore, such a description is completely lacking for LGN cells. It is the purpose of the present paper to describe the spatio-temporal response characteristics of RF centres and surrounds of cells in the M-, P- and K- layers of the LGN of a new world monkey - the common marmoset. We have used stimuli with different spatial arrangements so that the RF centre and surround contributions to the total response are varied. A similar approach was previously employed in cat retinal ganglion cells and LGN cells by measuring the responses to drifting gratings of different spatial frequencies (Enroth-Cugell et al. 1983; Dawis et al. 1984; Frishman et al. 1987). In the present paper, the results of measurements are presented using a different type of stimulus. The stimuli consisted of a centre and a surround region. The stimuli presented in the two regions were identical but in counterphase. The stimuli were presented concentrically with the RF centre, so that the centre and surround of the stimulus stimulated the RF centre and surround in different proportions. The relative contributions from the RF centres and surrounds could be varied, by changing the size of the centre stimulus.
We found that the RF centre-to-surround phase difference increased linearly with increasing temporal frequency, suggesting a constant delay difference of about 4.5 to 6 ms. A linear model, including low-pass filters, a lead lag stage and a delay, was used to describe the mean RF centre and surround responses as a function of temporal frequency. The separate responses of the RF centres and surrounds were found to be less temporally band pass than the full field responses (Kremers et al. 1997).
Colour vision in marmosets is polymorphic (Travis et al. 1988; Tovée et al. 1992). This polymorphism has a genetic basis: on the X-chromosome only one gene coding for a long or middle wavelength sensitive photopigment is present, but three different alleles of this gene exist (Williams et al. 1992; Hunt et al. 1993; Jacobs et al. 1993). As a result, all the males and about one-third of the females are dichromats. The remaining females are trichromats. Thus, the marmoset is a suitable animal model for the comparison of the response properties in dichromats and trichromats.
Parts of the results have been presented in abstract form (Kilavik & Kremers, 2000).
Methods
Animal preparation
All animal experiments were conducted in accordance with the principles regarding the care and use of animals adopted by the American Physiological Society and the Society for Neuroscience.
The animals were initially sedated by an intramuscular injection of 15–30 mg kg−1 ketamine hydrochloride (Ketanest, Parke-Davies) and either 3.5 mg kg−1 xylazine hydrochloride with 1.5 mg kg−1 methyl-4-hydrobenzoate (0.15 ml kg−1 Rompun 2 % solution, Bayer) or 1 mg kg−1 diazepam (Valium, MM Roche) and they were respired with a mixture of 70 % N2O and 30 % O2 or carbogen. During the operation and the measurements, anaesthesia was maintained by either adding 0.2–0.8 % enflurane (Ethrane, 0.4–0.8 % during surgery and 0.2–0.4 % during recordings) to the respired gas mixture or by a continuous intravenous application of 4–8 µg kg−1 h−1 sufentanil (Sufenta, Janssen) with an initial dose of 5 µg kg−1. Our observations confirmed previous reports that marmoset LGN cells were more responsive when the animals were anaesthetized with sufentanil in comparison with isoflurane anaesthesia, which is an isomer of enflurane (Solomon et al. 1999). To prevent eye movements, 5 mg kg−1 h−1 gallamine triethiodide (Flaxedil) was administered intravenously. A warming blanket connected to a rectal probe was used to maintain the rectal temperature at 37.2 ° C. The depth of anaesthesia was monitored by continuous recording of ECG and EEG. At the correct depth of anaesthesia, the EEG alternated between active and quiet periods and the heart rate did not fluctuate strongly even after potentially painful interventions.
The pupils were dilated with atropine sulfate (1 %) and neosynephrine (5 %). The eyes were refracted and focused with contact lenses on a tangent screen and the stimulus monitor at 114 cm distance. The contact lenses also protected the eyes against desiccation. Artificial pupils with 2 mm diameter were placed in front of the eyes.
A craniotomy was performed and a tungsten-in-glass electrode was lowered into the LGN. Once the action potentials of a cell were isolated, the responses to a battery of stimuli were recorded. The responses described in the present study are a subset of all recordings. The layers from which we recorded were identified by the sequence of ocular input of the cells and from small lesions made at the end of the electrode tracks. After the experiments, the animals were killed by an overdose of sodium pentobarbital (Narcoren; 160 mg ml−1; approximately 1 ml; the dose was considered to be sufficient when no EEG activity was observed and the heart rate was substantially reduced). Blood samples were obtained for genetic analysis. After perfusion, the brains were removed and prepared histologically to visualize the lesions.
The experiments were performed on 15 animals (11 dichromats - 10 males, one female; three female trichromats; and one female in which the colour vision phenotype could not be determined with certainty, but no clear signs of trichromacy could be detected during the measurements, and this animal was therefore classified as a dichromat in the data analysis). In 12 animals (eight males and four females), the alleles present on the gene locus coding for the cone photopigments were determined by a genetic analysis of blood samples of each animal (Williams et al. 1992; Hunt et al. 1993). In addition, the phenotype of the dichromats was determined electrophysiologically by searching for a silent substitution condition using the red and green phosphors of the computer-controlled stimulus monitor (Weiss et al. 1998). Briefly, the red and green phosphors were modulated in counterphase. The Michelson contrast of the modulation of the red phosphor was kept constant at 43 %, whereas the Michelson contrast of the green modulation was varied between 5 % and 80 % in 5 % steps. Dichromatic animals possess one of three possible cone photopigments in the middle and long wavelength range of the spectrum (with maximal absorption at 543, 556 or 563 nm). The excitation of each of these photopigments will not be modulated by the stimuli at a characteristic contrast of the green phosphor (the silent substitutions conditions: 32 % for the 543 nm pigment, 45 % for the 556 nm pigment and 54 % for the 563 nm pigment). At high retinal illuminances, P- and M-cells receive their input exclusively from this cone type (they have no S-cone input and the rod input will be negligible). The responses of the cells will therefore be minimal at the silent substitution condition of the present L/M-cone type. Furthermore, reliable measurements on only a few cells are sufficient to determine the cone photopigment phenotype. The results from the genetic analysis and the electrophysiological measurements in the dichromats were always in agreement with each other.
Visual stimuli
The stimuli were presented on a BARCO monitor (CCID 7751 MKII) controlled by a VSG 2/2 graphics card (Cambridge Research System). The monitor was positioned at a distance of 114 cm from the animal. The frame rate was 100 Hz. The distance between adjacent pixels was 400 µm (1.2 min of arc). The stimuli consisted of a centre that was concentric with the RF of the cell and a surrounding field, which covered the rest of the RF completely (outer diameter of the surrounding field was 5 deg). There is evidence that responses of primate LGN cells may be inhibited by areas outside the classical RF. The extraclassical inhibition might have been activated by our stimuli, but the inhibition was probably the same for all stimuli, because the size of the complete stimulus was constant (5 deg diameter) and because the spatial arrangement of the stimulus in the extraclassical RF does only have minor influence upon the responses (Solomon et al. 2002). To assure that the centre stimulus was concentric with the RF it was important to determine the position of the RF precisely. This was done with a bipartite field stimulus, with identical but counter-phase modulation in the two fields. When the common border between the two fields is located in the middle of the RF a sharp minimum in the responses of the cells is observed (Enroth-Cugell & Robson, 1966; Kremers & Weiss, 1997; Lee et al. 1998). A vertical and a horizontal edge were used to determine the middle of the RF in the horizontal and the vertical direction, respectively.
In the subsequent measurements, sinusoidal luminance modulation (50 % Michelson contrast) was presented in the centre and in the surround stimuli. The modulation in the two subfields was identical but in counterphase. The 50 % contrast was chosen because we wanted to obtain reliable responses for all spatial configurations of the stimulus (see below) including those which inherently give relatively small responses. The possible influence the relative high contrast has on the results is discussed separately (see Discussion). The mean luminance was 66 cd m−2 (20, 40 and 6 cd m−2 mean luminance of the red, green and blue phosphors respectively). We calculated that the total retinal illuminance is about 4.9 times larger than in the human eye and is equivalent to about 1000 trolands (Td). The radius of the centre stimulus was varied between 0 deg (full field modulation) and either 0.6 deg or 1.4 deg. The small range of stimulus centre sizes (up to 0.6 deg) was used for cells with small RF centres. Cells with larger RF centres were measured using the larger range of stimulus centre sizes (up to 1.4 deg). In some cells both ranges were employed. The responses were measured to a total of 16 different sizes of the centre stimulus. For the range with small stimulus centre sizes (up to 0.6 deg), the increments in size were, starting at 0 deg, initially 1 pixel (corresponding to 0.4 mm or 72 s of arc). The size increments gradually increased and were maximally 8 pixels at larger stimulus centres. For the range with large centre sizes (up to 1.4 deg) the initial size increments were 2 pixels. The size increments were maximally 16 pixels at larger stimulus centres. These measurements were repeated at up to nine different temporal frequencies between 1 and 30 Hz.
Results
Data were obtained from 17 P-cells (nine from dichromatic animals and eight from trichromatic animals), 15 M-cells (all from dichromatic animals) and three K-cells (two from one trichromatic animal and one blue-on cell from a dichromatic animal) at different temporal frequencies. Of an additional 12 M-cells, 11 P-cells and one K-cell (all except for one P-cell and the K-cell measured in dichromatic animals), the measurements were performed at 4 Hz only. The data relating to these measurements have only been included in the data analysis when explicitly indicated. Figure 1 shows the responses displayed as peristimulus time histograms (PSTHs) of an on-centre P-cell in a trichromatic animal (1st and 3rd row of PSTHs) and of an on-centre M-cell (2nd and 4th row of PSTHs). Subsequent data analysis showed that the M-cell had a slightly smaller centre (9.6 min of arc for the P-cell; 7.8 min of arc for the M-cell). The responses to six different sizes of the centre stimuli are shown. The temporal frequency was 4 Hz. At this temporal frequency, the RF centre and surround responded approximately antagonistically. In the first condition, the radius of the centre stimulus was 0 min of arc, resulting in a full field modulation of the cell. When a small centre stimulus was introduced, the phases of the responses were shifted, indicating that the responses to the two stimuli had similar amplitudes. Owing to the antagonistic responses to the centre and the surround stimuli, the response amplitudes decreased as centre stimulus size increased and a minimum was reached (for the P-cell at approximately 7.2 min of arc; for the M-cell at a smaller size of the centre stimulus (not shown)). At larger centre stimulus sizes, the total responses were clearly dominated by the responses to the centre stimulus, because the response phase coincides with the on-phase of the centre stimulus. For all responses at which the centre stimulus dominated the response, the response phase was relatively constant. A further centre stimulus size increase resulted in a response amplitude increase until a maximum was reached (at about 19.2 min of arc for the P-cell and at approximately 14.4 min of arc for the M-cell). At this maximum, the stimulus centre matched the RF centre optimally, so that the RF centre mainly responded to the stimulus centre and the RF surround mainly responded to the stimulus surround. Because of the counterphase modulation in the stimulus centre and surround and the antagonistic responses in the RF centre and surround, the RF surround response reinforced the response of the RF centre. With a further size increase, the stimulus centre encroached upon the RF surround, resulting in a subsequent response decrease, finally reaching the full field response again when the stimulus centre covered the complete RF of the cell.
Figure 1. Responses of an on-centre P-cell and an on-centre M-cell.
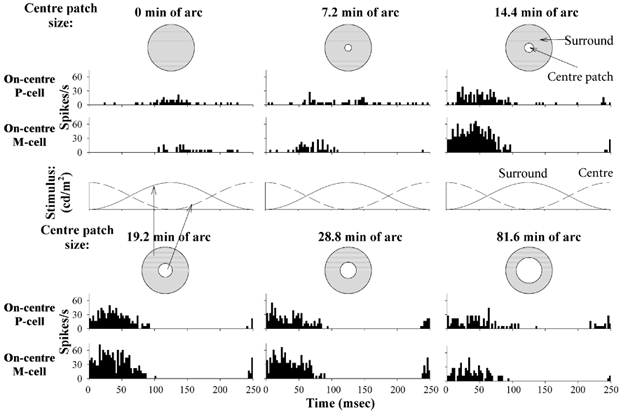
Responses of an on-centre P-cell in a trichromatic animal (1st and 3rd row of PSTHs) and an on-centre M-cell (2nd and 4th row) to different stimulus centre sizes, at a temporal frequency of 4 Hz. The M-cell had a slightly smaller RF centre size than the P-cell. One cycle (250 ms) is shown. 0 min of arc centre stimulus size indicates full field stimulation of the cell. The responses of the cells depended on stimulus centre size in a characteristic manner. For the P-cell, a minimal response amplitude was reached at about 7.2 min of arc for this particular cell and coincided with a large phase change. The minimal response of the M-cell occurred at a smaller centre stimulus size (not shown). The maximal response amplitude was achieved at approximately 19.2 min of arc for the P-cell and at approximately 14.4 min of arc for the M-cell.
The response amplitudes and phases were extracted from the Fourier analysis on the PSTHs by using the amplitudes and phases of the fundamental components. The response phases were expressed as the sine phase relative to the transition of the mean luminance in the surround stimulus. Response phase delays were given negative values; a response that led the stimulus had a positive phase. Figure 2 displays the response amplitudes (left panels) and phases (right panels) of the same P-cell, the responses of which are shown in Fig. 1, as a function of stimulus centre size. The responses are shown for five different temporal frequencies (the encircled data points at 4 Hz are shown in Fig. 1 as PSTHs). The curves are fits of a model to the data, which assumes that the RF centres and surrounds have Gaussian responsivity profiles. Further, it was assumed that the RF centres and surrounds are rotationally symmetric, concentric with the stimuli, and that the RF centres and surrounds have different response phases. The RF centre response amplitude to the stimulus centre patch (Rc,c) can be described by the following mathematical description:
 |
(1) |
in which r and φ are the radius and the angle of a pie with a Gaussian profile.
Figure 2. Response amplitudes and phases of an on-centre P-cell.
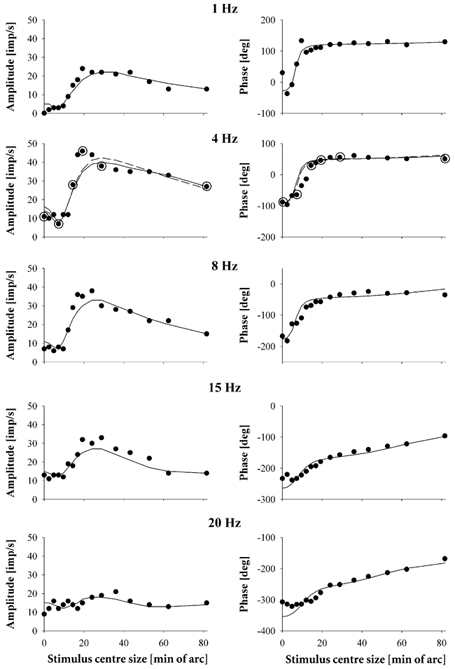
Response amplitudes (left panels) and phases (right panels) of the same on-centre P-cell, the responses of which are shown in Fig. 1, plotted as a function of stimulus centre size. Separate plots are shown for responses at five different temporal frequencies. The encircled data points at 4 Hz are the responses the PSTHs of which are shown in Fig. 1. The drawn curves are fits of a model that assumes Gaussian responsivity profiles and independent phases of RF centre and surround responses. The parameters obtained for the 4 Hz data are as follows: Ac: 2.85 imp s−1 (min of arc)−1; σc: 9.6 min of arc; φc: 225 deg; As: 0.24 imp s−1 (min of arc)−1; σs: 69.6 min of arc; φs: 20 deg; the estimated phase difference between centre and surround responses was 205 deg. The dashed curve in the 4 Hz plot is a fit of the model to the data using the solver routine of the Excel 97 program. The estimates of the parameters obtained this fit are: Ac: 3.03 imp s−1 (min of arc)−1; σc: 10.1 min of arc; φc: 238 deg; As: 0.32 imp s−1 (min of arc)−1; σs: 56.4 min of arc; φs: 32 deg; the estimated phase difference between centre and surround responses was 206 deg.
Solving the integrals results in:
 |
(2) |
in which ac is a centre response amplitude factor (in imp s−1 (min of arc)−1) and σc the standard deviation of the RF centre Gaussian, later referred to as RF centre radius; rp is the radius of the stimulus centre.
Similarly, the RF centre response amplitude to the stimulus surround (Rc,s) can be described as:
 |
(3) |
It was assumed that the surround stimulus covers the complete RF of the cell. Solving this equation results in:
 |
(4) |
Because the centre and the surround stimuli are modulated in counterphase, the total RF centre response amplitude (Rc) can be described as:
 |
(5) |
Ac is proportional to the RF centre response amplitude factor ( ). Ac σc is an overall amplitude scaling, whereas the last term describes the shape of the response curve. Note that Rc is zero when
 . The model assumes that the RF centres are radially symmetric. However, previous data show that they can be elongated (Hammond, 1974; Levick & Thibos, 1980; Vidyasagar & Urbas, 1982; Soodak et al. 1987; Kremers & Weiss, 1997). In those cases, it is expected that the model will deviate from the actual data, and σc in eqn (5) will give an overestimate of the short axis and an underestimate of the longer axis of the RF centre.
The surround response amplitude (Rs) was described similarly to the centre response, with the parameters As and σs, surround amplitude factor and standard deviation, respectively. The responses of the RF centres and surrounds were described as vectors. The lengths of the vectors encode the response amplitude, as described by eqn (5) for the RF centre. The angles of the vectors with the positive x-axis encode the phases of the responses (φc and φs for the RF centre and surround, respectively). φc and φs changed abruptly by 180 deg when Rc and Rs were zero respectively, indicating a change in stimulus (centre or surround) driving the response of the RF centre or the RF surround. The total cell response was assumed to be a vector addition of the centre and surround responses: . This model was fitted simultaneously to the response amplitudes and phases by searching for the least sum of squared distances in the vector plane.
At each temporal frequency, the model was fitted to the data. Thus, at each temporal frequency we obtained estimates of six free parameters: Ac, σc, φc, As, σs and φs. The estimated parameters were obtained in an iterative manner. The fitting procedure first scanned the complete space of possible values of these parameters in relatively coarse equidistant steps. The sum of squared distances in the vector plane for each combination of parameters was calculated. The scan was then repeated around the parameter values resulting in the least sum of squared distances in the previous scan. The steps and the range of the parameter values were smaller in this second scan. Again the sum of squared distances was calculated for all parameter combinations. This procedure was repeated four times. The fits were further constrained by the following additional assumptions. First, we assumed that the RF centres were smaller than or of equal size to the RF surrounds (φc ≤ φs). Second, we assumed that the RF centre response amplitudes were larger than those of the surrounds (Ac σc > As σs). Third, if the maximal encountered response was more than twice the full field response (i.e. with 0 deg centre stimulus size), it was assumed that the RF centre and surround responded more or less antagonistically. Therefore in the first scan the RF surround phase, φs, was set to have a phase difference of between 90 deg and 270 deg relative to φc. A full field modulation that was larger than any other encountered response indicates that RF centre and surround responses reinforce each other when modulated in phase. In that case φs was constrained to values between φc - 90 deg and φc + 90 deg in the first scan. For the remaining cases, we did not constrain φs. In general, the model provided satisfactory fits, although deviations appeared in some fits, especially around the maximal response amplitude, where the model predictions tended to underestimate the cell response amplitudes (cf. Fig. 2).
We tested the reliability of the fits by refitting the 4 Hz data shown in Fig. 2 using the solver routine of the Excel 97 program. The dashed curves in the 4 Hz plots show the resultant fits. As can be seen in the legend of Fig. 2, the estimated parameters obtained from the fits were relatively similar for both fits, especially the centre size, the centre amplitude factor and the phase difference between centre and surround responses. The surround size (σs; 69.6 min of arc in the original fits; 56.4 min of arc in the fits with the solver routine) and surround amplitude factors (As; 0.24 imp s−1 (min of arc)−1) for the original fits and 0.32 for the fits with the solver routine) deviated somewhat. The resultant surround amplitudes (As σs) were, however, very similar (16.7 imp s−1 for the original fit and 18.4 imp s−1 for the fits with the solver routine).
To study how robust the estimated parameters resulting from the fits are, we adopted a method described by Linsenmeier et al. (1982). For that, the surround parameters were fixed at the values obtained from the overall fits. Further, different centre sizes were assumed. Using the solver routine, the best fitting centre amplitude factors (Ac) and centre phases (φc) were determined for each centre size. As an estimate of the goodness of fit, the sum of squared distances in the vector plain was calculated for each fit. A better fit results in a smaller value of the sum of squared distances. The sum of squared distances in the best fits are shown in Fig. 3A as function of the centre size. There is a clear minimum in the sum of squared distances between 9 and 10 min of arc centre size. This indicates that the centre size could be estimated reliably. Furthermore, the centre response phases in the fits only marginally changed, indicating that they could also be estimated reliably.
Figure 3. Test of the reliability of the fitting parameters.
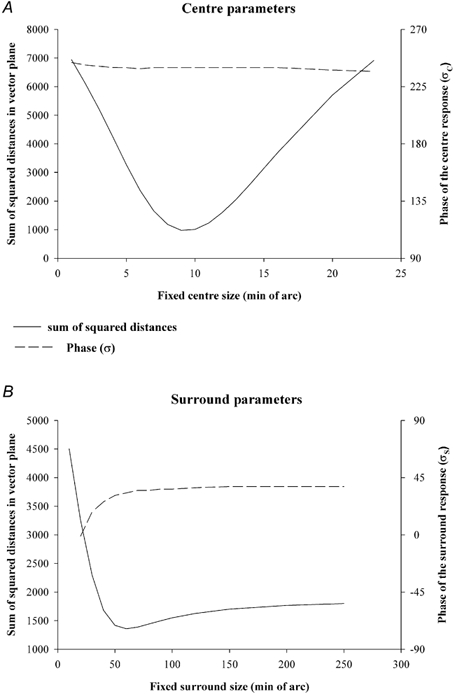
A, the reliability of the centre parameters estimated from the model fits to the 4 Hz data, shown in Fig. 2, were tested. The surround parameters were fixed to the values obtained from the overall fits. The centre size was also fixed in a fit. The fits were repeated for different centre sizes. The goodness of fit (quantified by the sum of squared distances in the vector plane; left ordinate) and the phase of the centre response (σc; right ordinate) are shown as a function of the centre size. The sum of squared distances displays a clear minimum, indicating the best combination of parameters and that the centre parameters can be estimated reliably. The value of σc was robust for the different centre sizes. The reliability of surround parameters was also tested (Fig. 3B). Centre parameters were taken from the overall fits. The surround size was varied in the different fits. The sum of squared distances displays a minimum but the increase is shallow for larger surround sizes. The value of σs is again relatively robust.
We also studied the reliability of the surround parameters by fixing the centre parameters at those obtained from the overall fits and by estimating the best fitting surround amplitude factors, amplitude phases and goodness of fits for different surround sizes. The results are shown in Fig. 3B. Here it can be seen that the slope in the goodness of fit is relatively shallow for large surround sizes. This indicates that an over-estimation of the surround size is possible, although too large surround sizes would result in obvious misfits of the response amplitudes, because the clear decrease in response amplitude at large centre stimulus sizes would not be present in the fits. We conclude that the surround sizes could be liable to an over-estimation in some cases, and that the response amplitude factors could be under-estimated in those cases (because the surround response amplitudes, As σs, were well constrained by the data). The estimated surround response phase did not change substantially in those fits that resulted in small sums of squared distances, indicating that it was well constrained by the data. For all cells, the surround response amplitudes were large enough to be able to estimate the surround response phases reliably.
We calculated the deviations between the measured and modelled response amplitudes and normalized them to the full field response amplitude for each cell to compensate for differences in responsivity between individual cells. The resulting normalized differences at three different temporal frequencies are shown in Fig. 4 as a function of stimulus centre size. A normalized deviation (ordinate) of zero indicates no difference between fit and the data; negative values indicate that the amplitude of the fit was larger than the actual measured response amplitude; positive values indicate an underestimation of the response amplitude data by the fit. To enable a comparison of the data from different cells, we normalized the stimulus centre size, rp, relative to the estimated RF centre size, for each cell. At a normalized stimulus centre size of one (abscissa), rp was equal to σc. Note that σc, the standard deviation of the RF centre Gaussian, has been used to define the RF centre radius. The point where the centre sensitivity has decreased to 1/e times the maximum is a factor of  larger. As a consequence, the maximal response amplitude can be expected to occur at larger stimulus centre sizes than σc.
Figure 4. Deviations between model fits and measured data.
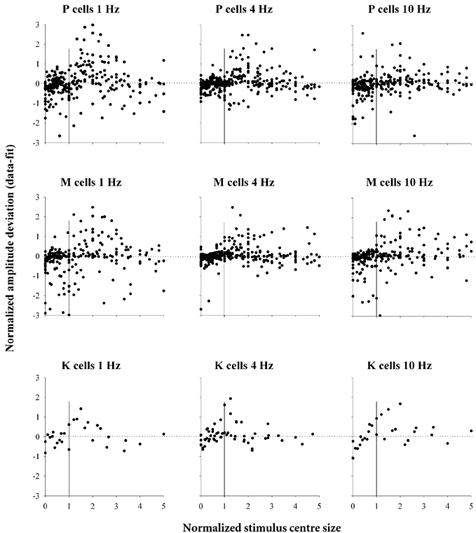
The normalized deviation in amplitudes, between the model fits and the measured responses, plotted as a function of normalized stimulus centre size. The amplitude deviation (ordinate) has been normalized for each cell to the full field response amplitude. The stimulus centre size (abscissa) has been normalized to the RF centre size of each individual cell. The data are shown separately for each cell type, at three different temporal frequencies.
Generally, the deviations between the fits and the original amplitude data were close to zero, indicating satisfactory fits. For normalized stimulus sizes smaller than one, where the minimal response amplitudes occur (see Fig. 1 and Fig. 2), there is less scatter in the data indicating only minor deviations in the fits, but a larger part of these deviations seem to be slightly negative, indicating a tendency to overestimate the response amplitudes somewhat by the fits. Such deviations can be expected when the RF field centres were actually not completely radially symmetric as assumed by the model. Above normalized centre stimulus sizes of one, where the maximal response amplitudes occur, there is larger scatter in the deviations and a majority of the deviations tend to be positive, indicating that the response amplitudes are more often underestimated by the fits. No obvious differences in the quality of the fits can be observed between different cell types and between the three different temporal frequencies that are displayed.
In Fig. 5, the estimates of the RF centre and surround sizes, estimated from the 4 Hz data, are plotted as a function of retinal eccentricity. The data from the cells, that were exclusively measured at 4 Hz, are included. There is a large variability in the cell sizes, in particular for the P-cells. In the plots, the data from P-cells that were measured in trichromatic animals and in dichromatic animals are displayed separately (no M-cells were measured in trichromatic animals). Linear regressions are shown for the M-cells and separately for the P-cells from dichromats (PDI) and trichromats (PTRI). RF centre and surround sizes increased for all cell types with increasing retinal eccentricity. Surprisingly, the PTRI-cells seemed to have larger centre and surround sizes than the PDI-cells, whereas only a minor difference can be seen between M-cells and PDI-cells, although there is a somewhat steeper increase in RF centre size with increasing eccentricity for the M-cells than for the PDI-cells. A covariance test revealed highly significant differences between the centre and the surround sizes of the different cell types (P < 0.0001 for the centre and P < 0.0002 for the surround). A Tukey's Honest Significant Difference test (with 5 % significance level) showed a significant difference between M-cells and PTRI-cells and between PDI- and PTRI-cells for the centre. For the surround, only the difference between PDI- and PTRI-cells was significant. Because of this difference between PDI- and PTRI-cells we treated these cells separately in the subsequent analysis. The K-cells were not included in the statistical analysis; we had data from only four K-cells. Three of these K-cells (all measured in one trichromatic animal) had larger centres and surrounds than most M- and P-cells at equivalent retinal eccentricity. One K-cell (a blue-on cell in a dichromatic animal) had smaller RF centre and surround than the other K-cells.
Figure 5. RF centre and surround sizes as a function of retinal eccentricity.
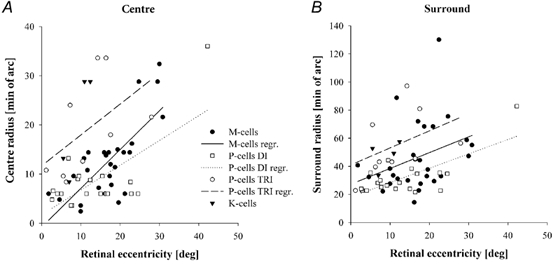
RF centre (left panel) and surround (right panel) sizes, measured at 4 Hz temporal frequency, as a function of retinal eccentricity. Linear regressions are shown for the M-cells and separately for the P-cells from dichromatic (PDI) and trichromatic (PTRI) animals. RF centre and surround sizes increase for all cell types with increasing retinal eccentricity with a somewhat steeper increase for the M-cells than for the P-cells.
The centre sizes of 18 cells (9 P-cells and 9 M-cells) were also measured with 25 % contrast drifting gratings (Kremers et al. 2001). The centre sizes estimated with these two methods were similar (with correlation coefficient, r, of 0.66). Furthermore, the centre sizes of a partially overlapping population of cells (17 P-cells; 12 M-cells; 3 K-cells) were estimated with bipartite field stimuli (Kremers & Weiss, 1997). Again the two methods yielded similar centre sizes (r = 0.71).
In Fig. 6 the mean centre and surround sizes for P- and M-cell types are plotted against temporal frequency. To compensate for size differences between individual cells, we normalized the sizes of each cell at the different temporal frequencies to their size at 4 Hz, at which all cells were measured. The mean normalized centre sizes maximally varied by only a factor of 1.2. The changes in mean normalized surround size were generally smaller than a factor of 2. For both P- and M-cells, there was no significant influence of temporal frequency on the centre and surround radii. Data from K-cells are not shown because the sample size was considered to be too small to be reliable, but the centre and surround sizes of the few K-cells we measured did not show a dependency on temporal frequency either.
Figure 6. Mean RF centre and surround sizes vs. temporal frequency.
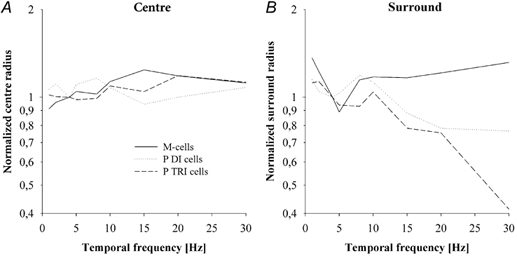
Mean RF centre (left panel) and surround (right panel) sizes of M- and P-cells as a function of temporal frequency. The data are normalized to 1 at 4 Hz. The data show no obvious influence of temporal frequency on RF centre or surround sizes.
The centre and surround amplitude factors were strongly correlated with the centre and surround radii, respectively. On the basis of the data obtained at 4 Hz, enabling the inclusion of those cells that were exclusively measured at this frequency, the relationship could be described by  for the centre and by
 for the surround. From eqn (5) it can be seen that the responses of the RF centre and surround to a full field stimulus (when rp = 0 or when rp ≫ σc and rp ≫ σs) can be described by: Rc = Ac σc and Rs = As σs. Substituting the above relationships between amplitude factor and size shows that the centre and surround response amplitudes to full field stimuli increase shallowly with increasing centre size
 . These results are in accordance with previous data from retinal ganglion cells and LGN neurones in different primate species (Irvin et al. 1993; Croner & Kaplan, 1995; Solomon et al. 1999; Kremers et al. 2001; White et al. 2001) and from cat retinal ganglion cells (Linsenmeier et al. 1982).
In Fig. 7, the mean ratio between centre and surround amplitude factors (Ac /As) is plotted as a function of temporal frequency for the different cell types. The ratios decrease with increasing temporal frequency for all cell types. Again K-cell data are not presented in Fig. 7 because of the small sample size, but the ratio of the few cells that were measured also decreased with increasing temporal frequency.
Figure 7. Ratios of RF centre-to-surround amplitude factors vs. temporal frequency.
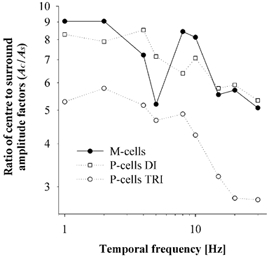
The mean ratio of RF centre-to-surround amplitude factors of P-cells in dichromats and trichromats and of M-cells as a function of temporal frequency. For all cell types, there is a decrease in the ratio with increasing temporal frequency, indicating that the RF surrounds have a higher temporal resolution than the RF centres. The dichromats have similar ratios for both M- and P-cells, whereas the trichromats clearly have smaller P-cell amplitude factor ratios than the dichromats.
From the estimated values of the centre and surround phases (φc and φs) we calculated the centre-to-surround phase difference for each cell at each temporal frequency. The mean differences between the centre and surround phases of P- and M-cells are shown in Fig. 8 as a function of temporal frequency. The phase difference increases with increasing temporal frequency. Furthermore, the relationship between the two is approximately linear, suggesting that there is a time delay difference between centre and surround responses. From the slopes of the linear regressions, the centre-surround delay differences for the different cell types can be calculated. These are 4.7 ms and 4.3 ms for the PDI- and PTRI-cells, respectively, and 6.0 ms for the M-cells. The K-cells that were measured also displayed an increase of the centre-to-surround phase difference with temporal frequency with an estimated delay difference of approximately 6.3 ms (data not shown). These phase differences are similar to those of retinal ganglion cells belonging to the P-pathway in macaques (Lee et al. 1989; Smith et al. 1992; Benardete & Kaplan, 1997; Lankheet et al. 1998). To our knowledge, to date no data are available on monkey M- and K-cells. A t test failed to confirm that the delay difference in the P-cells on the one hand and the M- and K-cells on the other hand were significantly distinct.
Figure 8. Phase difference between RF centre and surround responses vs. temporal frequency.
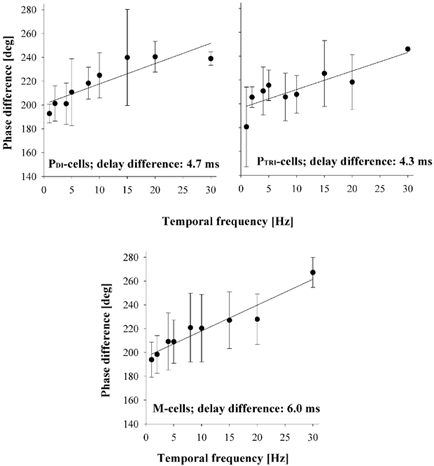
The mean phase difference between RF centre and surround responses as a function of temporal frequency, plotted separately for M- and P-cells. The phase difference increases with increasing temporal frequency and the approximately linear relationship between the two indicates a pure time delay difference between centre and surround responses. This time delay difference is about 4.7 ms for the PDI-cells, 4.3 ms for the PTRI-cells and 6.0 ms for the M-cells.
We calculated the mean centre and surround amplitude factors and phases obtained from the data on individual cells, at each temporal frequency. In Fig. 9, the mean centre and surround amplitude factors (middle panels) and phases (lower panels) of P- and M-cells are plotted as a function of temporal frequency. The P-cells in trichromats have lower amplitude factors than those in dichromats. This is related to the finding that P-cells in the trichromats have larger RF centre and surround sizes than those in the dichromats (Fig. 4) and that size and amplitude factor are inversely related.
Figure 9. Amplitude factors and phases of RF centre and surround responses vs. temporal frequency - a comparison with full field response amplitudes.
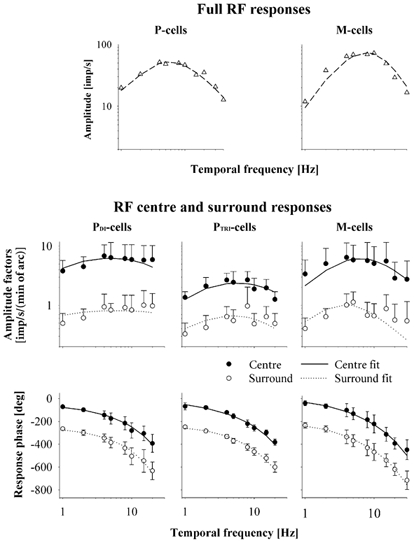
Mean RF centre and surround amplitude factors (middle panels) and phases (lower panels) shown as a function of temporal frequency for P-cells from dichromats and from trichromats and for M-cells. The curves are fits of a linear model including a lead lag, a delay and a cascade of low-pass filters. A reasonably good fit could be obtained. The model fits are less satisfactory for the M-cell RF centres at low temporal frequencies and surrounds at high temporal frequencies. Replots of the mean amplitudes of full field responses in dichromatic animals (Kremers et al. 1997) are displayed in the upper panels as a function of temporal frequency. The full field responses are more band pass than the separate responses of the RF centres and surrounds.
The data were fitted by a cascade of low-pass filters, a lead lag stage and a time delay. Similar models were used to describe temporal modulation transfer functions of full field responses of marmoset LGN cells (Kremers et al. 1997) and of macaque retinal ganglion cells (Purpura et al. 1990). The following mathematical formula describes the linear model:
 |
(6) |
It is assumed that the data can be described by N1 low-pass filters with time constants τ1, N2 low-pass filters with time constant τ2 and a pure time delay D. The term between the large square brackets is a lead lag stage, introduced to describe the decrease in response at low temporal frequency. α describes the amplitude ratio between low and optimal frequency and T is a time constant (Milsum, 1966). A is a constant controlling the overall response and can be considered as the response at 0 Hz. This model was fitted to the mean data by using the solver routine in the Microsoft Excel program. We constrained N1 and N2 to values between 0 and 50 and the time constants τ1 and τ2 were constrained between 1 and 1000 ms, so that the filters had cut-off frequencies within the range of employed temporal frequencies of the stimuli. α, describing the low frequency roll-off, was constrained to values below 500. None of the free parameters could have negative values. We also varied the number of lead-lag stages. Two or more stages did not improve the fits significantly, so that we used only one lead lag stage for all fits. In modelling full field data of marmoset LGN cells and macaque retinal ganglion cells, two lead lag stages were needed to optimize the fits (Purpura et al. 1990; Kremers et al. 1997). The curves in Fig. 9 are the fits of the filter model to the data. The 30 Hz data of the P-cells were not included in the fits because only one trichromatic and two dichromatic P-cells were measured at 30 Hz. The phases for on- and off-centre cells were superimposed on each other by shifting the phases of the off-centre cells by 180 deg. Fixed time delays (D) of 32 ms and of 37 ms were used for the M-cell centres and for the P-cell centres, respectively. These values were based upon full field data (Kremers et al. 1997). It is implicitly assumed that these time delays were mainly influenced by the centre responses. The response delay of the M-cell surrounds was set to 38 ms, taking into account the approximately 6 ms centre-to-surround delay difference that was estimated from the data shown in Fig. 7. The response delay of the P-cell surrounds was fixed at 41.5 ms according to the additional 4.5 ms delay relative to the centre. K-cell data are not shown, but were fitted with the filter model as well. The fixed time delays for the K-cells were set to values similar to those for the M-cells; 32 ms for the centre and 38 ms for the surround, because the previous study obtained no time delays for K-cells (Kremers et al. 1997), and the centre-to-surround phase difference was similar for M- and K-cells.
The filter model fits the centre and surround response amplitude factors and phases relatively well for all cell types. However, at low temporal frequencies, the model underestimates the amplitude factors of the M-cell RF centres. This was also observed when modelling the full field responses of M-cells (Kremers et al. 1997). Furthermore, the RF surround response amplitude factors are underestimated at higher temporal frequencies for the M-cells. The M-cell responses are less band pass than the model description, although they are more band pass than the P-cell responses. The fits to the P-cell data were better and showed fewer band-pass characteristics.
The estimated parameters obtained from the fits are given in Table 1. The values in the last column of the table give a quantification of the goodness of the fits. It is defined as the sum of squared distances between measurements and fits in the vector plane, normalized to the maximal response and divided by the number of data points used in the fits. Small values indicate good fits. N1 and N2 quantify the number of low-pass filters. Except for the fit to the surround responses of PDI-cells, just one low-pass filter was sufficient to obtain optimal fits. In modelling full field data of marmoset LGN cells (Kremers et al. 1997) and macaque retinal ganglion cells (Purpura et al. 1990), more low-pass filters were generally needed to get satisfactory fits. α quantifies the low frequency roll-off of the response amplitude factors; the larger the values of α, the more band pass the response characteristics are. Table 1 shows that α tended to be somewhat larger in the fits of the M- and K-cells than those of the P-cells, indicating, as observed above, that these cell types were somewhat more band pass.
Table 1.
Fitting parameters of the linear filter model to the mean response data for each cell type
| Cell type | Number of cells | Fixed delay time (ms) | N1 | τ1(ms) | N2(ms) | τ2(ms) | α | T(ms) | Normalized sum of squares |
|---|---|---|---|---|---|---|---|---|---|
| PDI centre | 9 | 37 | 1 | 109.90 | 0 | — | 36.20 | 17.47 | 0.201 |
| PDI surround | 9 | 41.5 | 12 | 1 | 0 | — | 1.67 | 1.04 | 0.057 |
| PTRI centre | 8 | 37 | 1 | 85.71 | 0 | — | 126.72 | 16.57 | 0.060 |
| PTRI surround | 8 | 41.5 | 1 | 75.85 | 0 | — | 17.49 | 12.32 | 0.023 |
| M centre | 15 | 32 | 1 | 14.94 | 0 | — | 275.63 | 3.68 | 0.144 |
| M surround | 15 | 38 | 1 | 41.59 | 0 | — | 11.69 | 3.83 | 0.026 |
| K centre | 3 | 32 | 1 | 6.69 | 0 | — | 500 | 2.30 | 0.117 |
| K surround | 3 | 38 | 1 | 6.62 | 0 | — | 239.16 | 2.70 | 0.029 |
The fits were made using one lead lag stage.
As temporal frequency increased, the response phases of both the centres and the surrounds decreased (lower panels in Fig. 9). Similar to the full RF responses in marmoset LGN cells (Kremers et al. 1997) and macaque retinal ganglion cells (Lee et al. 1990), the M-cell RF centres and surrounds responded in a phase-advanced manner relative to the responses of P-cell RF centres and surrounds. This is illustrated in Fig. 10, in which the mean centre and surround response phases of the two cell types at 1 and 2 Hz are replotted in more detail. The difference in response phase between the different cell types at low temporal frequencies was maximally 40 deg for the RF centres and the RF surrounds. The centres and surrounds of the K-cells that were measured also responded in a phase advanced manner relative to those of the P-cells.
Figure 10. Response phase at low temporal frequencies.
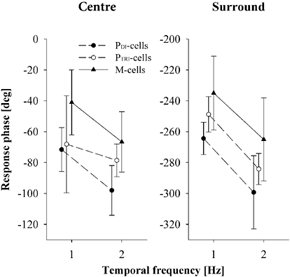
The mean response phases of M- and P-cells at 1 and 2 Hz temporal frequency, separately for the RF centres and surrounds, replotted with a higher response phase resolution. For clarity, the data from the different cell types have been displaced by 0.1 Hz along the abscissa relative to each other. The M-cell RF centre and surround responses are generally phase-advanced compared to those of the P-cells at low temporal frequencies.
The amplitude factors of the RF centres and surrounds (shown in the middle panels of Fig. 9) are less band pass than the amplitude gains when the complete RF is stimulated. In Fig. 9 (upper panels) the mean amplitudes of full field responses measured in dichromatic animals are replotted (Kremers et al. 1997). Although response amplitudes and amplitude factors are different quantities, the temporal characteristics should be comparable, because the RF size, which links the two quantities to each other, does not depend on temporal frequency (Fig. 6). We have plotted the full field responses obtained at 50 % contrast, which is the same contrast as we have used in this study. There were minor differences in other aspects between the stimuli in the two studies: the previous study used stimuli consisting of yellow light flickering at a mean retinal illuminance of 615 Td, whereas our stimuli were white with a mean illuminance of about 1000 Td. The fits with the filter model are included in the plots. It can be seen that better fits could be obtained to the full field data than to the separate RF centre and surround responses, especially for M-cells. The low temporal frequency roll-off is larger for full field responses than for the RF centre and surround responses. As a result, the amplitude difference between low and optimal temporal frequency was larger for the full field responses. The low-pass cut-off of the RF centre and surround responses occurs at higher temporal frequencies than in the full field responses.
Discussion
Modelling the response at different centre stimulus sizes
The linear model assumes Gaussian responsivity profiles of the RF centres and surrounds and different response phases. The model can describe the response amplitudes as a function of stimulus centre size adequately. However, there are systematic deviations relative to the measured data, with a tendency to overestimate the minimal response amplitudes and to underestimate the maximal response amplitudes (Fig. 4). Possibly, there are centre-surround interactions in the responses that cannot be captured with the linear model.
In another set of experiments, centre-surround interactions were observed in marmoset LGN cells using stimuli similar to those presented here: a stimulus centre was adjusted in size to fit the RF centre size of each cell (the stimulus that provides the maximal response amplitude with the stimuli described in the present paper). The relative temporal phase between centre and surround stimuli was then varied, and the response was compared with the responses to selective centre and selective surround stimulation (Kremers, 2001). The presence of a surround response led to a small amplitude reduction of the RF centre response but had no effect on the phase of the RF centre response. The presence of a centre stimulus had a variable effect on the amplitude of the RF surround response and resulted in a considerable phase advance in the RF surround response. The deviation between fits and measurements we find here, for the stimulus conditions close to optimal stimulus centre size, might be related to the previously found non-linear interactions between RF centre and surround.
Centre and surround size
We found that centre and surround sizes increase with increasing retinal eccentricity (Fig. 5). This has been found previously for RF centres of monkey LGN cells and retinal ganglion cells (de Monasterio & Gouras, 1975; Derrington & Lennie, 1984; Blakemore & Vital-Durand, 1986; Crook et al. 1988; Irvin et al. 1993; Lee et al. 1993, 1998; Croner & Kaplan, 1995; Kremers & Weiss, 1997; Kremers et al. 2001; White et al. 2001) and for RF surrounds of monkey retinal ganglion cells (Croner & Kaplan, 1995). Moreover, our data confirm observations that M- and P-cell RF centre sizes are more similar than is expected on the basis of dendritic tree diameters and that there is a large variability between individual cells belonging to the same type and located at similar retinal eccentricities (Kaplan & Shapley, 1982; Derrington & Lennie, 1984; Blakemore & Vital-Durand, 1986; Crook et al. 1988; Lee et al. 1993; Kremers & Weiss, 1997; Kremers et al. 2001; White et al. 2001). Only a few studies resulted in significantly larger RF centres of M-cells than of P-cells at equivalent retinal eccentricities (de Monasterio & Gouras, 1975; Irvin et al. 1993; Croner & Kaplan, 1995). Recently, it was found that K-cells have larger RF centres than most M- and P-cells (White et al. 2001). We also found that three of the four K-cells that were measured had quite large RF centres and surrounds compared to M- and P-cells at equivalent retinal eccentricities.
Between 1 and 30 Hz the RF centre and surround sizes do not depend on temporal frequency (Fig. 6). This is accordance with data on RF centre sizes of cat LGN and retinal ganglion X-cells up to about 30 Hz (Enroth-Cugell et al. 1983; Dawis et al. 1984). However, an increase in centre size was observed when the temporal frequency was increased beyond 30 Hz (Frishman et al. 1987). Owing to the delay difference between RF centre and surround (Fig. 8; Enroth-Cugell et al. 1983; Dawis et al. 1984; Frishman et al. 1987; Lee et al. 1989; Smith et al. 1992; Benardete & Kaplan, 1997), the surround responses at 30 Hz are less opponent than at low temporal frequencies. As a consequence, some of the RF surround response contributions may have been attributed to the RF centre response resulting in a seemingly larger RF centre size at the higher temporal frequencies. Frishman et al. (1987) found no systematic change in surround size of the X-cells for temporal frequencies up to about 60 Hz. In contrast, Dawis et al. (1984) found a decrease in surround size with increasing temporal frequency up to 24 Hz for a LGN X-cell, whereas measurements of S-potentials of an X-cell indicated an increase in surround size up to 3 Hz, above which the size of the surround was independent of temporal frequency. Thus, the literature data are inconclusive. Our data indicate that the sizes of the RF centres and surrounds do not change systematically with temporal frequency.
Centre and surround response characteristics
We found that the response phases of RF centres and surrounds decrease with increasing temporal frequency for all cell types (Fig. 9) and that the responses in M-cells are somewhat phase-advanced relative to those of P-cells (Fig. 10). Previous studies have shown a centre-to-surround delay difference in P-cells in the macaque retina of about 3–8 ms (Lee et al. 1989; Smith et al. 1992; Benardete & Kaplan, 1997; Lankheet et al. 1998). A similar analysis of the M-cells was not possible due to their frequency-doubled responses to the stimuli used in those experiments. No data were available on the centre and surround response phases of K-cells. We found that the delay differences in P-, M- and K-cells are all similar (between 4.5 and 6 ms) and are also similar to those recorded in the macaque. This centre-to-surround delay difference is also comparable to what has been found for cat retinal ganglion cells (Enroth-Cugell et al. 1983; Dawis et al. 1984; Frishman et al. 1987), demonstrating that this relationship also holds across different mammalian species.
With increasing temporal frequency, the centre-to-surround amplitude factor ratio decreases (Fig. 7), indicating that the RF surrounds have a higher temporal resolution than the RF centres. A decrease of a centre-to-surround gain ratio is also apparent in the responses of retinal ganglion cells belonging to the P-pathways (Benardete & Kaplan, 1997). For M-cells, Benardete & Kaplan (1999) presented the gains of responses to annuli and to spots as a function of temporal frequency. In accordance with our data, the ratio of the gains to the annuli and to the spot stimuli increased with increasing temporal frequency. A similar result was also found in cat retinal ganglion cells (Frishman et al. 1987), where the surround-to-centre strength ratio increased abruptly above approximately 30 Hz. On the basis of theoretical considerations, it has been hypothesized that RF size might be positively correlated with the temporal resolution (Silveira, 1996; Silveira & De Mello, 1998). In the common marmoset it has been found that the contrast gain to temporal modulation changes with retinal eccentricity (Solomon et al. 1999), suggesting that indeed there might be a correlation between temporal and spatial properties of the RFs. If there is a causal relationship between temporal and spatial properties of RFs, then the current data show that a similar relationship might be present in substructures of the RFs.
We also found that the amplitude factors of RF centres and surrounds are inversely related to RF size. Furthermore, the centre and surround response amplitudes increase shallowly with increasing size. This has been observed previously in monkey and cat retinal ganglion cells and LGN cells (Linsenmeier et al. 1982; Irvin et al. 1993; Croner & Kaplan, 1995; Solomon et al. 1999; Kremers et al. 2001; White et al. 2001).
The RF centre and surround response amplitude factors for both P- and M-cells are less band pass (Fig. 9) than full field response amplitudes of marmoset LGN cells (Kremers et al. 1997). The high temporal frequency cut-off is above 30 Hz for RF centre and surround responses and is approximately 20 Hz for full field responses. Furthermore, the low temporal frequency roll-off is larger for full RFs than for the RF centres and surrounds. These two differences may have separate origins: the lower cutoff frequency for the full RFs might be caused by the higher temporal resolution of the RF surrounds, as is shown in Fig. 7. The ratio between amplitude factors of the RF centre and surround decreases with increasing temporal frequency and, owing to the (still) antagonistic responses of the surround, the overall response amplitude might decrease more strongly with increasing temporal frequency than would be expected solely on the basis of the RF centre or surround amplitude factors. A stronger opponency of the RF surround at low temporal frequencies (Fig. 8) could be the cause for the larger low temporal frequency roll-off in full field responses.
We used a linear model, including low-pass filters, a lead lag and a delay to describe the mean RF centre and surround amplitude factors and phases as a function of temporal frequency, for the different cell types. Similar linear filter models have been used previously to describe full field responses of macaque retinal ganglion cells (Purpura et al. 1990) and marmoset LGN cells (Kremers et al. 1997). In these two studies, two lead lag stages were needed to optimize the fits. In addition, Purpura et al. (1990) needed more stages of low-pass filters, probably because they did not include a delay in their model. We needed only one lead lag stage for an optimal fit, and in most cases only one low-pass filter was sufficient to describe the data. Possibly, our data are simpler, because the RF centres and surrounds are modelled separately, and in the fits to full field responses, RF centre-surround interactions might lead to more complex data. The linear model fitted the P-cell responses better than the M-cell responses (Fig. 9), indicating more linear response characteristics of the centres and surrounds of P-cells. This was also concluded from the fits of the model to full field responses of marmoset LGN cells (Kremers et al. 1997). Our data therefore show that at least part of the non-linearities in full field responses are already present in the responses of their subfields and are not caused by the interaction between RF centres and surrounds.
Nonlinear saturation may have been introduced by the use of a relatively high (50 %) contrast in the stimulus. Saturation possibly has two separate sources (Kremers et al. 2001): internal response saturation, which is contrast-dependent, and limitation in the maximal feasible response. The former would have no influence on the linear model we used to describe the cell data, because the compression of the responses would be the same at all stimulus conditions. The second type of saturation would cause a response compression, especially at high response amplitudes. This would be the case when the centre of the stimulus matches the RF centre. Indeed we find that in these stimulus conditions, there are deviations between the fits of the linear model and the data (Fig. 4). However, most of these deviations point at an accelerating non-linearity rather than at a saturation. Thus if saturation influences our data, it is probably overruled by another, accelerating non-linearity.
Are there differences between dichromats and trichromats?
We found a difference in the RF dimensions between P-cells of dichromatic and trichromatic marmosets. The RF centres and surrounds were significantly larger in trichromats than in dichromats (Fig. 5). Because of the relationship between RF size and amplitude factor, the amplitude factors in the trichromats were smaller than in the dichromats, suggesting that the overall response amplitudes are similar. Other spatio-temporal characteristics of the RF centres and surrounds, such as response phase and centre-to-surround phase difference, as well as the strong relationship between RF size and sensitivity, were similar in the P-cells of dichromats and trichromats. Other studies have led to the conclusion that only minor differences in spatial and temporal characteristics were present between dichromats and dichromats (Yeh et al. 1995b; Lee et al. 1996; Kremers & Weiss, 1997; Kremers et al. 1997). Our data indicate that there might be, in fact, some differences between RF dimensions in dichromats and trichromats within one species, although the small sample size, especially of ‘trichromatic’ P-cells, prohibits more definite conclusions. Four of the eight ‘trichromatic’ P-cells, included in the present study, stemmed from one animal. The present data prompted us to re-evaluate data on RF centre sizes measured with either bipartite fields (seven ‘trichromatic’ and 55 ‘dichromatic’ P-cells) or with drifting gratings (five ‘trichromatic’ and 21 ‘dichromatic’ P-cells). Indeed the majority of the ‘trichromatic’ P-cells had larger RF centres. However, in total only three of the ‘trichromatic’ P-cells measured with the other stimulus types were not included in the present study. Furthermore, these three cells stemmed from the same animal from which most ‘trichromatic’ P-cell data in the present study were obtained. Thus, although these three cells also had large RF centres in comparison with those cells measured in dichromats, the data should be considered with some caution. Although much effort was made to keep the optics optimal, the possibility cannot be excluded that the large centre sizes are caused by a poor quality of the retinal image in this particular animal.
Unfortunately, we have no recordings from M-cells in trichromatic animals (with any of the three stimulus methods). These measurements might be important to establish whether or not an increased RF size is confined to P-cells or is a general feature in trichromats.
Stronger rod inputs, even at high retinal illuminances, have been observed in some P-cells in the dichromatic marmoset, compared to P-cells in the trichromatic marmoset (Yeh et al. 1995b). Cells in dichromatic marmosets were also found to receive rod inputs up to higher retinal illuminances than those in trichromatic macaque monkeys (Lee et al. 1997; Weiss et al. 1998). It is not clear whether a difference in rod input might be related to the observed difference in RF size.
Acknowledgments
The authors wish to thank Eva Burkhardt for technical support and Gaute Einevoll and Vladislav Kozyrev for valuable comments on the data analysis. B.E.K. was supported by DFG grant GKR173/5-01. J.K. was supported by a Heisenberg fellowship (DFG Kr1317/5-2) and DFG SFB430 TP C3. L.C.L.S. is a CNPq research fellow. B.E.K., L.C.L.S. and J.K. were supported by CAPES-PROBRAL grant no. 079/99 and DAAD grant 415-br-probral/bu.
References
- Benardete EA, Kaplan E. The receptive field or the primate P retinal ganglion cells, I: Linear systems. Vis Neurosci. 1997;14:169–185. doi: 10.1017/s0952523800008853. [DOI] [PubMed] [Google Scholar]
- Benardete EA, Kaplan E. The dynamics of primate M retinal ganglion cells. Vis Neurosci. 1999;16:355–368. doi: 10.1017/s0952523899162151. [DOI] [PubMed] [Google Scholar]
- Benardete EA, Kaplan E, Knight BW. Contrast gain control in the primate retina: P cells are not X-like, some M cells are. Vis Neurosci. 1992;8:483–486. doi: 10.1017/s0952523800004995. [DOI] [PubMed] [Google Scholar]
- Blakemore CB, Vital-Durand F. Organization and post-natal development of the monkey's lateral geniculate nucleus. J Physiol. 1986;380:453–491. doi: 10.1113/jphysiol.1986.sp016297. [DOI] [PMC free article] [PubMed] [Google Scholar]
- Croner LJ, Kaplan E. Receptive fields of P and M ganglion cells across the primate retina. Vision Res. 1995;35:7–24. doi: 10.1016/0042-6989(94)e0066-t. [DOI] [PubMed] [Google Scholar]
- Crook JM, Lange-Malecki B, Lee BB, Valberg A. Visual resolution of macaque retinal ganglion cells. J Physiol. 1988;396:205–224. doi: 10.1113/jphysiol.1988.sp016959. [DOI] [PMC free article] [PubMed] [Google Scholar]
- Dawis SM, Shapley R, Kaplan E, Tranchina D. The receptive field organization of X-cells in the cat: spatiotemporal coupling and asymmetry. Vision Res. 1984;24:549–564. doi: 10.1016/0042-6989(84)90109-3. [DOI] [PubMed] [Google Scholar]
- De Monasterio FM, Gouras P. Functional properties of ganglion cells of the rhesus monkey retina. J Physiol. 1975;251:167–195. doi: 10.1113/jphysiol.1975.sp011086. [DOI] [PMC free article] [PubMed] [Google Scholar]
- Derrington AM, Lennie P. Spatial and temporal contrast sensitivities of neurones in lateral geniculate nucleus of macaque. J Physiol. 1984;357:219–240. doi: 10.1113/jphysiol.1984.sp015498. [DOI] [PMC free article] [PubMed] [Google Scholar]
- Enroth-Cugell C, Robson JG. The contrast sensitivity of retinal ganglion cells of the cat. J Physiol. 1966;187:517–552. doi: 10.1113/jphysiol.1966.sp008107. [DOI] [PMC free article] [PubMed] [Google Scholar]
- Enroth-Cugell C, Robson JG, Schweitzer-Tong DE, Watson AB. Spatio-temporal interactions in cat retinal ganglion cells showing linear spatial summation. J Physiol. 1983;341:279–307. doi: 10.1113/jphysiol.1983.sp014806. [DOI] [PMC free article] [PubMed] [Google Scholar]
- Frishman LJ, Freeman AW, Troy JB, Schweitzer-Tong DE, Enroth-Cugell C. Spatiotemporal frequency responses of cat retinal ganglion cells. J Gen Physiol. 1987;89:599–628. doi: 10.1085/jgp.89.4.599. [DOI] [PMC free article] [PubMed] [Google Scholar]
- Hammond P. Cat retinal ganglion cells: size and shape of receptive field centres. J Physiol. 1974;262:237–264. doi: 10.1113/jphysiol.1974.sp010696. [DOI] [PMC free article] [PubMed] [Google Scholar]
- Hunt DM, Williams AJ, Bowmaker JK, Mollon JD. Structure and evolution of the polymorphic photopigment gene of the marmoset. Vision Res. 1993;33:147–154. doi: 10.1016/0042-6989(93)90153-n. [DOI] [PubMed] [Google Scholar]
- Irvin GE, Casagrande VA, Norton TT. Centre/surround relationships of magnocellular, parvocellular, and koniocellular relay cells in primate lateral geniculate nucleus. Vis Neurosci. 1993;10:363–373. doi: 10.1017/s0952523800003758. [DOI] [PubMed] [Google Scholar]
- Jacobs GH, Neitz J, Neitz M. Genetic basis of polymorphism in the color vision of platyrrhine monkeys. Vision Res. 1993;33:269–274. doi: 10.1016/0042-6989(93)90083-9. [DOI] [PubMed] [Google Scholar]
- Kaplan E, Shapley RM. X and Y cells in the lateral geniculate nucleus of macaque monkeys. J Physiol. 1982;330:125–143. doi: 10.1113/jphysiol.1982.sp014333. [DOI] [PMC free article] [PubMed] [Google Scholar]
- Kilavik BE, Kremers J. Influence of temporal frequency on interactions between receptive field centres and surrounds of marmoset LGN cells. Inv Ophthalmol Vis Sci. 2000;41(suppl):50. [Google Scholar]
- Kremers J. Interactions between receptive field centres and surrounds in marmoset LGN cells and the correlation with psychophysics. Inv Ophthalmol Vis Sci. 2001;42(suppl):406. [Google Scholar]
- Kremers J, Lee BB. Comparative retinal physiology in Anthropoids. Vision Res. 1998;38:3339–3344. doi: 10.1016/s0042-6989(97)00343-x. [DOI] [PubMed] [Google Scholar]
- Kremers J, Silveira LCL, Kilavik BE. Influence of contrast on the responses of marmoset lateral geniculate cells to drifting gratings. J Neurophysiol. 2001;85:235–246. doi: 10.1152/jn.2001.85.1.235. [DOI] [PubMed] [Google Scholar]
- Kremers J, Weiss S. Receptive field dimensions of lateral geniculate cells in the common marmoset (Callithrix jacchus) Vision Res. 1997;37:2171–2181. doi: 10.1016/s0042-6989(97)00041-2. [DOI] [PubMed] [Google Scholar]
- Kremers J, Weiss S, Zrenner E. Temporal properties of marmoset lateral geniculate cells. Vision Res. 1997;37:2649–2660. doi: 10.1016/s0042-6989(97)00090-4. [DOI] [PubMed] [Google Scholar]
- Kuffler SW. Discharge patterns and functional organization of mammalian retina. J Neurophysiol. 1953;16:37–68. doi: 10.1152/jn.1953.16.1.37. [DOI] [PubMed] [Google Scholar]
- Lankheet MJM, Lennie P, Krauskopf J. Temporal-chromatic interactions in LGN P-cells. Vis Neurosc. 1998;15:47–54. doi: 10.1017/s0952523898151015. [DOI] [PubMed] [Google Scholar]
- Lee BB. Receptive field structure in the primate retina. Vision Res. 1996;36:631–644. doi: 10.1016/0042-6989(95)00167-0. [DOI] [PubMed] [Google Scholar]
- Lee BB, Kremers J, Yeh T. Receptive fields of primate retinal cells studied with a novel technique. Vis Neurosc. 1998;15:161–175. doi: 10.1017/s095252389815112x. [DOI] [PubMed] [Google Scholar]
- Lee BB, Martin PR, Valberg A. Amplitude and phase of responses of macaque retinal ganglion cells to flickering stimuli. J Physiol. 1989;414:245–263. doi: 10.1113/jphysiol.1989.sp017686. [DOI] [PMC free article] [PubMed] [Google Scholar]
- Lee BB, Pokorny J, Smith VC, Kremers J. Responses to pulses and sinusoids in macaque ganglion cells. Vision Res. 1994;34:3081–3095. doi: 10.1016/0042-6989(94)90074-4. [DOI] [PubMed] [Google Scholar]
- Lee BB, Pokorny J, Smith VC, Martin PR, Valberg A. Luminance and chromatic modulation sensitivity of macaque ganglion cells and human observers. J Opt Soc Am A. 1990;7:2223–2236. doi: 10.1364/josaa.7.002223. [DOI] [PubMed] [Google Scholar]
- Lee BB, Silveira LCL, Yamada E, Kremers J. Parallel pathways in the retina of old and new world primates. Rev Bras Biol. 1996;56:323–338. [PubMed] [Google Scholar]
- Lee BB, Smith VC, Pokorny J, Kremers J. Rod inputs to macaque ganglion cells. Vision Res. 1997;37:2813–2828. doi: 10.1016/s0042-6989(97)00108-9. [DOI] [PubMed] [Google Scholar]
- Lee BB, Wehrhahn C, Westheimer G, Kremers J. Macaque ganglion cell responses to stimuli that elicit hyperacuity in man: Detection of small displacements. J Neurosc. 1993;13:1001–1009. doi: 10.1523/JNEUROSCI.13-03-01001.1993. [DOI] [PMC free article] [PubMed] [Google Scholar]
- Levick WR, Thibos LN. Orientation bias of cat retinal ganglion cells. Nature. 1980;286:389–390. doi: 10.1038/286389a0. [DOI] [PubMed] [Google Scholar]
- Linsenmeier RA, Frishman LJ, Jakiela HG, Enroth-Cugell C. Receptive field properties of X and Y cells in the cat retina derived from contrast sensitivity measurements. Vision Res. 1982;22:1173–1183. doi: 10.1016/0042-6989(82)90082-7. [DOI] [PubMed] [Google Scholar]
- Milsum JH. Biological Control Systems Analyis. New York: McGraw-Hill Co.; 1966. [Google Scholar]
- Purpura K, Tranchina D, Kaplan E, Shapley RM. Light adaptation in the primate retina: analysis of changes in gain and dynamics of monkey retinal ganglion cells. Vis Neurosci. 1990;4:75–93. doi: 10.1017/s0952523800002789. [DOI] [PubMed] [Google Scholar]
- Silveira LCL. Joint entropy loci of M and P cells: A hypothesis for parallel processing in the primate visual system. Rev Bras Biol. 1996;56:345–367. [PubMed] [Google Scholar]
- Silveira LCL, De Mello HD., Jr . Parallel pathways of primate vision; Sampling of information in the Fourier space by M and P cells. In: Chalupa LM, Finlay B, editors. Development and Organization of the Retina. New York: Plenum Press; 1998. pp. 173–199. [Google Scholar]
- Smith VC, Lee BB, Pokorny J, Martin PR, Valberg A. Responses of macaque ganglion cells to the relative phase of heterochromatically modulated lights. J Physiol. 1992;458:191–221. doi: 10.1113/jphysiol.1992.sp019413. [DOI] [PMC free article] [PubMed] [Google Scholar]
- Solomon SG, White AJR, Martin PR. Temporal contrast sensitivity in the lateral geniculate nucleus of a New World monkey, the marmoset Callithrix jacchus. J Physiol. 1999;517:907–917. doi: 10.1111/j.1469-7793.1999.0907s.x. [DOI] [PMC free article] [PubMed] [Google Scholar]
- Solomon SG, White AJR, Martin PR. Extraclassical receptive field properties of parvocellular, magnocellular, and koniocellular cells in the primate lateral geniculate nucleus. J Neurosci. 2002;22:338–349. doi: 10.1523/JNEUROSCI.22-01-00338.2002. [DOI] [PMC free article] [PubMed] [Google Scholar]
- Soodak RE, Shapley RM, Kaplan E. Linear mechanism of orientation tuning in the retina and the lateral geniculate nucleus of the cat. J Neurophysiol. 1987;58:267–275. doi: 10.1152/jn.1987.58.2.267. [DOI] [PubMed] [Google Scholar]
- Tovée MJ, Bowmaker JK, Mollon JD. The relationship between cone pigments and behavioural sensitivity in a New World monkey (Callithrix jacchus jacchus) Vision Res. 1992;32:867–878. doi: 10.1016/0042-6989(92)90029-i. [DOI] [PubMed] [Google Scholar]
- Travis DS, Bowmaker JK, Mollon JD. Polymorphism of visual pigments in a callitrichid monkey. Vision Res. 1988;28:481–490. doi: 10.1016/0042-6989(88)90170-8. [DOI] [PubMed] [Google Scholar]
- Vidyasagar TR, Urbas JV. Orientation sensitivity of cat LGN neurones with and without inputs from visual cortical areas 17 and 18. Exp Brain Res. 1982;46:157–169. doi: 10.1007/BF00237172. [DOI] [PubMed] [Google Scholar]
- Weiss S, Kremers J, Maurer J. Interaction between rod and cone signals in responses of lateral geniculate neurons in dichromatic marmosets (Callithrix jacchus) Vis Neurosci. 1998;15:931–943. doi: 10.1017/s0952523898155177. [DOI] [PubMed] [Google Scholar]
- White AJR, Solomon SG, Martin PR. Spatial properties of koniocellular cells in the lateral geniculate nucleus of the marmoset Callithrix jacchus. J Physiol. 2001;533:519–535. doi: 10.1111/j.1469-7793.2001.0519a.x. [DOI] [PMC free article] [PubMed] [Google Scholar]
- Williams AJ, Hunt DM, Bowmaker JK, Mollon JD. The polymorphic photopigments of the marmoset: spectral tuning and genetic basis. EMBO J. 1992;11:2039–2045. doi: 10.1002/j.1460-2075.1992.tb05261.x. [DOI] [PMC free article] [PubMed] [Google Scholar]
- Yeh T, Lee BB, Kremers J. The temporal response of ganglion cells of the macaque retina to cone-specific modulation. J Opt Soc Am A. 1995a;12:456–464. doi: 10.1364/josaa.12.000456. [DOI] [PubMed] [Google Scholar]
- Yeh T, Lee BB, Kremers J, Cowing JA, Hunt DM, Martin PR, Troy JB. Visual responses in the lateral geniculate nucleus of dichromatic and trichromatic marmosets (Callithrix jacchus) J Neurosci. 1995b;15:7892–7904. doi: 10.1523/JNEUROSCI.15-12-07892.1995. [DOI] [PMC free article] [PubMed] [Google Scholar]