



Abstract
Neuroimaging is a popular method to map brain structural and functional patterns to complex human traits. Recently published observations cast doubt upon these prospects, particularly for prediction of cognitive traits from structural and resting state functional magnetic resonance imaging (MRI). We leverage baseline data from thousands of children in the Adolescent Brain Cognitive DevelopmentSM Study to inform the replication sample size required with univariate and multivariate methods across different imaging modalities to detect reproducible brain-behavior associations. We demonstrate that by applying multivariate methods to high-dimensional brain imaging data, we can capture lower dimensional patterns of structural and functional brain architecture that correlate robustly with cognitive phenotypes and are reproducible with only 41 individuals in the replication sample for working memory-related functional MRI, and ~ 100 subjects for structural and resting state MRI. Even with 100 random re-samplings of 100 subjects in discovery, prediction can be adequately powered with 66 subjects in replication for multivariate prediction of cognition with working memory task functional MRI. These results point to an important role for neuroimaging in translational neurodevelopmental research and showcase how findings in large samples can inform reproducible brain-behavior associations in small sample sizes that are at the heart of many research programs and grants.
Keywords: brain-behavior associations, multivariate modeling, neurocognition, structural MRI, task functional MRI
Introduction
Understanding how the brain gives rise to behavior is a central goal and challenge of modern neuroscience. Non-invasive neuroimaging techniques have yielded valuable opportunities to link brain structure and function with cognitive and mental health phenotypes, which in turn could be useful to predict later behavioral outcomes (Kardan et al. 2022). However, recent reports have provided evidence that call into question the reproducibility of brain-behavior associations across various magnetic resonance imaging (MRI) modalities (Elliott et al. 2020; Kelly Jr and Hoptman 2022; Kennedy et al. 2022; Marek et al. 2022; Liu et al. 2023), even in large samples such as the Adolescent Brain Cognitive DevelopmentSM Study (ABCD Study®), which have yielded much smaller effect sizes than anticipated (Dick et al. 2021).
Recent reports have suggested that studies require thousands of individuals to be sufficiently powered to measure reproducible brain-behavior associations when applying commonly used univariate statistical methods (Marek et al. 2022; Liu et al. 2023). This has resulted in significant concerns across the brain imaging community, and beyond, about the value of MRIin trying to understand human behavior, particularly for the preponderance of investigations that have been conducted in sample sizes well under one hundred, let alone thousands, of individuals. Dozens of research groups and media outlets have independently responded to this highly cited claim of thousands of individuals being required in brain-wide association studies, including many commentaries (“Cognitive neuroscience at the crossroads” 2022, “Revisiting doubt in neuroimaging research” 2022; Bandettini et al. 2022; Deyoung et al. 2022; Gratton et al. 2022; Kong et al. 2022; Rosenberg and Finn 2022; Tiego and Fornito 2022; Valk and Hettwer 2022; Chakravarty 2022; Uddin 2023), reports using synthetic data (Cecchetti and Handjaras 2022; Gell et al. 2023), neuroimaging/cognitive data from the UK Biobank and/or Human Connectome Project (Cecchetti and Handjaras 2022; Gell et al. 2023; Spisak et al. 2023), and psychopathology/genetic data from the ABCD Study (Tiego et al. 2023). Across this wave of responses, it has become increasingly clear that hundreds of individuals should be sufficient to measure reproducible brain-behavior associations, particularly with the right choice of multivariate prediction methods (Spisak et al. 2023) and a more intentional focus on specific behavioral phenotypes.
It remains to be seen how such multivariate methods enhance power to predict behavior in a neurodevelopmental sample such as the ABCD Study. Further, many reports focusing on brain-behavior reproducibility issues have focused on resting state functional MRI (fMRI), necessitating a broader investigation of different imaging modalities, including structural and diffusion MRI, and task-evoked brain activation with fMRI. Marek, Tervo-Clemmens and colleagues (Marek et al. 2022) examined both multivariate methods and task fMRI, but did not highlight these results in the main conclusions of their paper, and used a multivariate technique that may not have been optimal in predicting cognition (Spisak et al. 2023). Task fMRI is of particular interest in the prediction of cognitive performance, given its success in mapping patterns of brain activity evoked by different tasks, identifying both distributed and specific neural responses to different processing demands. Our group and others have recently shown that task-evoked activation outperforms resting state functional connectivity measures when predicting cognition in the ABCD study (Chen et al. 2022; Omidvarnia et al. 2023; Zhao et al. 2023), and similar conclusions have been drawn in other samples of youth and adults (Rosenberg et al. 2016; Greene et al. 2018; Jiang et al. 2020; Finn and Bandettini 2021).
Here we compare the sample sizes required to detect reproducible brain-behavior associations across imaging modalities using univariate and multivariate methods. We demonstrate that by applying multivariate prediction methods that are sensitive to the complex familial structure of the ABCD study, we can capture significant patterns of associations between behavior and lower dimensional representations of structural/functional brain architecture, reducing the burden of multiple comparisons common to univariate studies. Multivariate analyses in turn yield larger effect sizes and more reproducible patterns of brain-behavior associations, negating the need for thousands of individuals, and instead showing sufficient power can be reached with well under one hundred individuals.
Materials and methods
Participants
Participants were drawn from the baseline visit of the ABCD Study, a longitudinal neuroimaging study that tracks brain and behavioral development of ~ 11,880 children starting at 9–10 years of age. The ABCD Study represents a demographically and ethnically diverse cohort of youth in the United States, and includes an embedded twin cohort and siblings. Informed consent was obtained from parents/caretakers and assent was obtained from the children. More detailed descriptions of recruitment and data collection within the ABCD sample can be found in (Garavan et al. 2018; Volkow et al. 2018). See Supplementary Tables 1 and 3 for sample details per imaging modality.
Imaging features predicting general cognition
We used six MRI-derived cortical features from three imaging modalities to predict general cognitive performance, defined by the Total Composite Score from the NIH Toolbox Cognition Battery, as described by Luciana et al. (2018). This cognitive measure allows for direct comparison with recent studies using the same outcome variable in ABCD (Sripada et al. 2020; Marek et al. 2022). A schematic of the imaging measures is shown in Supplementary Fig. 1, and more details on image processing are included in previous publications (Casey et al. 2018; Hagler Jr et al. 2019) and in Supplementary Methods. For measures derived from sMRI, we focused on cortical surface area (SA) and cortical thickness (CT). For dMRI, we used measures derived from restriction spectrum imaging (RSI) (White et al. 2013; Palmer et al. 2022), including restricted normalized directional diffusion (RND) within superficial white matter, and restricted normalized isotropic diffusion (RNI) intracortically. As a supplementary analysis, we also included fractional anisotropy (FA) within superficial white matter from diffusion tensor modeling as a comparison to RND (see Supplementary Material).
For task fMRI, we chose to focus on the emotional n-back (ENb) task, which taps into working memory and emotional regulation (Barch et al. 2013; Cohen et al. 2016; Casey et al. 2018). Our recent work showed that task-based functional connectivity and parameter estimates from the ENb task are more predictive of general cognition than the other two tasks within the ABCD protocol, i.e. the stop signal task and monetary incentive delay task (Zhao et al. 2023). We applied standard processing of time series data, assuming a single fixed impulse response function across task conditions and brain regions. For each participant, we extracted the task model parameters derived from a general linear model applied to the time series data, which included the beta estimates of the task condition regressors (Hagler Jr et al. 2019) for the contrast between 2-back and 0-back trials, irrespective of the type of stimulus presented (i.e. emotional face or place). An average of the task model parameters across two runs was calculated.
Finally, we also included resting state (RS) fMRI correlation matrices, which estimate pair-wise correlations of brain activity at rest across 333 cortical regions from the Gordon parcellation (Gordon et al. 2016). We also explored prediction performance of the 13 functional network communities derived from the Gordon parcellation that are frequently analyzed in the neuroimaging literature (e.g. default mode, fronto-parietal, dorsal attention, etc.).
Univariate and multivariate subsampling scheme
A repeated hold-out validation scheme with 100 random subsamples was used to estimate the out-of-sample prediction performance of each imaging measure on general cognition. Each input imaging measure included 5124 features (reflecting the number of vertices), with the exception of the RS data, which comprised a 333 × 333 correlation matrix. For each of the 100 iterations, 90% of the sample was randomly assigned to the discovery sample and the remaining 10% to replication. Participants from the same family were kept within the same training and testing set during the cross validation.
Univariate associations
Within each training set defined through the subsampling scheme described above, the mass univariate correlation between each imaging measure and general cognition were estimated after regressing out age, sex, scanner ID, and software version, consistent with previous work (Sripada et al. 2020; Chaarani et al. 2021; Marek et al. 2022; Zhao et al. 2023). Within each iteration, the vertex with the absolute maximum correlation coefficient was identified and the outcome was defined as the correlation coefficient at that same vertex in the test set, and averaged across 100 iterations.
Multivariate prediction
Principal component analysis (PCA) and ridge regression using the Matlab function fitrlinear were utilized together to predict the behavioral outcome of the unseen, test-set participants. More details can be found in Supplementary Methods. Confounding effects of the same covariates used in univariate analyses (age, sex, scanner ID and software version) were removed before out-of-sample prediction. PCA and ridge regression implemented in Matlab’s fitrlinear was utilized to predict the behavioral outcome of the unseen, test-set participants. For each iteration, PCA was carried out first on the discovery sample, with the same transformation subsequently applied to the replication set. Normalization of imaging data before dimensionality reduction was also done within the cross-validation framework. The shrinkage parameter value, λ, was set to 1, consistent with previous work (Spisak et al. 2023). The k value, representing the fraction of principal components used in prediction, was empirically determined as follows. First, 15 different values of k spanning 0 to 1 (i.e. 0.001, 0.0016, 0.0027, 0.0044, 0.0072, 0.012, 0.019, 0.032, 0.052, 0.085, 0.14, 0.23, 0.37, 0.61, 1.00) were tested in a first round of 100 random subsamples, split into 90% and 10% discovery and replication datasets, respectively. The k value that yielded the optimal prediction performance was then subsequently used in a second iteration of 100 random subsamples, from which prediction performance was evaluated. The empirically determined k value per imaging modality and behavioral measure is listed in Supplementary Table 3.
The correlation between the predicted and the observed behavioral score was used as the metric for out-of-sample behavioral prediction performance of each imaging measure. The standard deviation of the correlation estimates took into consideration the expected 10% overlap in replication datasets given the 90/10 split utilized in our cross-validation scheme. Specifically, all standard deviation estimates were scaled up by a factor of ~ 1.05, based on the finite population correction 1/√(1−p) (where p is the expected proportion overlap between replication samples of 0.1) (Bondy and Zlot 1976). To investigate the performance of smaller discovery sample sizes, we also applied the same subsampling scheme over nine different discovery sample sizes spanning from 10 to 5,000 participants in log units (n = 10, 22, 47, 103, 224, 486, 1,057, 2,299, 5,000) for prediction of cognition from imaging features, while fixing the replication sample size to be n = 1,000 across discovery sample sizes. For standard deviation estimates in this case, p reflected 1,000/nmodality. Note, for prediction with the fMRI-derived features, there were not enough participants left over at a discovery sample size of n = 5,000 to reach a replication sample of n = 1,000. Thus, we only estimated out-of-sample performance up to a discovery sample size of n = 2,299 for these features.
Generation of power curves
Power curves were generated in Matlab, where the replication sample size needed to achieve a desired level of power was defined as follows (Hulley et al. 2013) and consistent with recent papers (Marek et al. 2022; Spisak et al. 2023):

where Zα represents the standard normal score for a given two-tailed alpha level (set to 0.05 in our work); Zβ represents the standard normal score for a given beta-value (e.g. 0.2 for 80% power) and C = arctan(r), where r represents the absolute maximum correlation for univariate analyses, taken as the mean correlation across 100 iterations of out-of-sample prediction for multivariate analyses.
Prediction performance for other phenotypes
Beyond general cognitive ability, we also investigated the prediction of 7 other phenotypes (Supplementary Table 2; Supplementary Fig. 5), including 1 in-scanner behavioral task (accuracy on 2-back trials within the ENb task), 3 out-of-scanner cognitive measures (crystallized [comprised of Picture Vocabulary and Oral Reading tasks] and fluid composite [comprised of Pattern Comparison Processing Speed, List Sorting Working Memory, Picture Sequence Memory, Flanker, and Dimensional Change Card Sort tasks] scores from the NIH Toolbox, and Matrix Reasoning from the Wechsler Intelligence Test for Children-V (Wechsler 2014) and 3 measures of psychopathology (internalizing and externalizing symptoms from the Child Behavior Checklist, as well as a p factor calculated from the Child Behavior Checklist subscale scores, as presented in Clark et al. (2021)).
Specificity of task fMRI contrast for prediction
To determine whether task functional activation patterns predicting cognition are strengthened when using a task-based contrast relevant for the predictive variable (e.g. 2- vs 0-back trials as presented in our main analyses), or can be generalized to any task-based contrast, we assessed predictive performance of three additional contrasts from the ENb task on general cognition. This included two non-working memory related contrasts (e.g. faces vs places; emotional vs. neutral faces), and one contrast with a lower working memory load (e.g. 0-back trials only).
Results
Participants
Final sample sizes per modality were: structural MRI (sMRI), n = 11,174 (47.96% female), mean age in months (std) = 119.04 (7.50); diffusion MRI (dMRI), n = 10,200 (48.44% female), mean age in months (std) = 119.11 (7.50); task fMRI, n = 5673 (49.29% female), mean age in months (std) = 119.80 (7.96); and RS fMRI, n = 5321 (50.4% female), mean age in months (std) = 119.90 (7.53). Included participants and sample sizes (Supplementary Tables 1 and 3) varied by imaging modality based on recommended inclusion flags (e.g. includes quality control criteria across modalities, and behavioral performance cut-offs for task fMRI; see Supplementary Table 4).
Univariate associations and absolute maximum correlations between imaging features and general cognition
Resultant cortical maps depicting brain-behavior univariate correlations are in Fig. 1A and resting state fMRI univariate correlations in Fig. 1B. Generally, correlations between brain structure and general cognition were weak (max |r| = 0.151, 0.150, 0.122 for CT, RND, and RNI, respectively), with slightly larger effect sizes for SA globally with total composite scores (SA max |r| = 0.215). RS fMRI yielded similar univariate associations as the structural measures (RS max |r| = 0.16). The strongest associations between the chosen imaging measures and general cognition emerged for ENb 2- vs. 0-back task parameter estimates (ENb max |r| = 0.287). Notable positive associations emerged with dorsolateral and medial prefrontal cortices and precuneus bilaterally predicting total composite scores.
Fig. 1.

Univariate associations, estimated with Pearson r correlations, between general cognition and: A. Five vertex-wise cortical features; and B. Resting state correlation data across 333 cortical regions from the Gordon parcellation. In panel B, regions are clustered by resting-state network for visualization purposes only. Abbreviations: SA, surface area; CT, cortical thickness; RND, restricted directional diffusion within superficial white matter; RNI, restricted isotropic diffusion intracortically; ENb, emotional N-back task fMRI, reflecting the 2- vs. 0-back contrast. RS, resting state fMRI. Aud, Auditory; CingOp. Cingulo-Opercular; CingPar. Cingulo-parietal; Def. Default mode; DorAtt. Dorsal attention; FrPar,fronto-parietal; RsTemp. Retrosplenial temporal; Sal. Salience; SMhand. Sensorimotor hand; SMmouth. Sensorimotor mouth; VenAtt, ventral attention; Vis. Visual.
Multivariate associations
Results from multivariate prediction, using PCA and ridge regression in a repeated hold-out validation scheme with 100 random subsamples, are shown in Fig. 2A. When exploring the prediction performance of the functional correlations between 13 pre-defined functional networks (Gordon et al. 2016) (e.g. default mode, dorsal attention, fronto-parietal, etc.), we found very poor performance across both multivariate (r = 0.008 + 0.043) and univariate (r = −0.005 + 0.040) methods, even with opposite signs in the correlation between observed and predicted values of general cognition. We thus focused on the functional correlations between the full Gordon parcellation with 333 regions for all analyses using resting-state fMRI as an imaging predictor in this work.
Fig. 2.
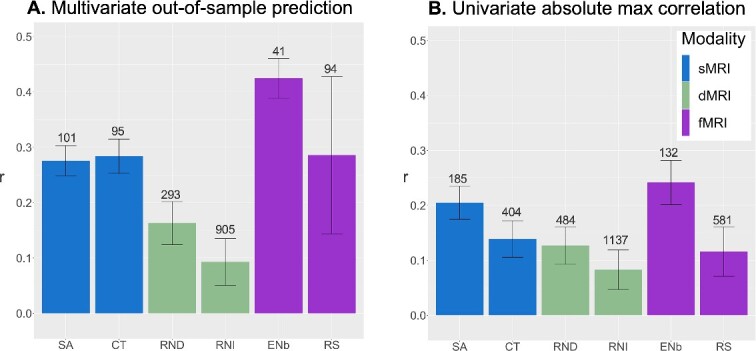
Comparison of out-of-sample prediction performance from multivariate analyses (panel A) per imaging measure/modality, vs. maximum absolute correlations derived from univariate analyses (panel B). Error bars reflect standard deviation, adjusted for the 10% sample overlap in test datasets. Numbers above each bar reflect the sample size required to achieve 80% power to detect effects in a replication sample, given the uncovered r values from the ABCD discovery sample. Abbreviations: sMRI, structural MRI; dMRI, diffusion MRI; fMRI, functional MRI; SA, surface area; CT, cortical thickness; RND, restricted directional diffusion within superficial white matter; RNI, restricted isotropic diffusion intracortically; ENb, emotional N-back task fMRI, reflecting the 2- vs. 0-back contrast; RS, resting state fMRI.
Multivariate prediction was comparable across sMRI features (SA: r = 0.276 + 0.027 [adjusted standard deviation of the predicted correlation across folds, taking into consideration 10% overlap in test datasets]; CT: r = 0.284 + 0.031) and resting state (RS: r = 0.286 + 0.142), but still remained weak for dMRI features (RND in superficial white matter: r = 0.163 + 0.039; RNI intracortically: r = 0.093 + 0.042). Task fMRI estimates yielded the best prediction performance, with r = 0.425 + 0.036.
For comparison, univariate correlation values were defined as the mean maximum absolute correlation value across iterations with the following outcomes (also shown in Fig. 2B): SA: r = 0.205 + 0.03; CT: r = 0.139 + 0.033; RND in superficial white matter: r = 0.127 + 0.034; RNI intracortically: r = 0.083 + 0.036; ENb: r = 0.242 + 0.04; RS: r = 0.116 + 0.045). As expected, multivariate analyses yielded stronger effects than univariate analyses, particularly for sMRI and fMRI measures. Only a small boost in power was observed for dMRI measures when using multivariate as compared with univariate methods, with particularly little improvement for intracortical restricted diffusion. Results were comparable for RND and FA in superficial white matter (Supplementary Fig. 2), with a slightly larger boost with multivariate methods for RND (~22% increase in prediction from univariate to multivariate) compared to FA (15% increase).
Power calculations
Power curves for multivariate and univariate outcomes are shown in Fig. 3A and B, respectively. To achieve 80% power to detect the measured brain-behavior associations with multivariate analyses, approximately 100 subjects in the replication sample are required across sMRI features and RS. Samples of 293 and 905 subjects are required for RND and RNI from dMRI, respectively. For ENb fMRI features, only 41 subjects are required. This can be compared to the higher number of subjects required with univariate associations; specifically, 185 subjects for surface area features, 404 for cortical thickness, over 480 for dMRI features, 132 for ENb fMRI features, and 581 for RS. These out-of-sample replication sample sizes based on prediction performance follow classic power law principles as previously reported (Spisak et al. 2023). Plots of sign error rates by sample size are included in Supplementary Fig. 3.
Fig. 3.

Power curves displaying replication sample sizes required (x-axis: Log-scale N) to achieve desired level of power (y-axis) based on performance of each imaging measure in predicting general cognition in replication sample using (A) multivariate vs (B) univariate methods. Abbreviations: SA, surface area; CT, cortical thickness; RND, restricted directional diffusion within superficial white matter; RNI, restricted isotropic diffusion intracortically; ENb, emotional N-back task fMRI, reflecting the 2- vs. 0-back contrast; RS, resting state fMRI.
Prediction performance as a function of discovery sample size
The above analyses define the replication sample size required to achieve a desired level of power, given the thousands of individuals used in the discovery sample. Our final set of analyses explored the out-of-sample prediction performance achieved over nine different discovery sample sizes spanning from 10 to 5,000 participants in log units (n = 10, 22, 47, 103, 224, 486, 1,057, 2,299, 5,000) for prediction of cognition from imaging features (Fig. 4), with the same prediction scheme as described above, and selecting a random subsample of n = 1,000 participants from the remaining sample to be used as the replication set. Consistent with the results presented above, a clear advantage for multivariate as compared to univariate methods was observed for sMRI (Fig. 4A) and task fMRI features (Fig. 4E). For example, with ~ 100 subjects in the discovery sample, a prediction performance of r = 0.34 was obtained for multivariate methods using ENb fMRI features, corresponding to approximately 66 subjects in the replication sample required to achieve 80% power. This can be compared with r = 0.14 with univariate methods (~398 subjects required) given 100 subjects in the discovery sample.
Fig. 4.

Replication curves showing out-of-sample prediction performance (defined by r on the y-axis) for each of the six imaging measures predicting general cognition, as a function of sample size in the discovery sample (represented on the x-axis in log-scale units). Replication sample size was fixed to be n = 1,000 across discovery sample sizes. For prediction with the fMRI-derived features, there were not enough participants left over at a discovery sample size of n = 5,000 to reach a replication sample of n = 1,000. Thus we only estimated out-of-sample performance up to a discovery sample size of n = 2,299 for these features. Multivariate metrics are compared to univariate r-values, reflecting the absolute maximum correlation value. Error bars reflect standard deviation, adjusted for sample overlap in the replication datasets, and are jittered for better visualization. Abbreviations: sMRI. Structural MRI; dMRI. Diffusion MRI; fMRI. Functional MRI; SA. Surface area; CT. Cortical thickness; RND. restricted directional diffusion within superficial white matter; RNI. Restricted isotropic diffusion intracortically; ENb. Emotional N-back task fMRI, reflecting the 2- vs. 0-back contrast; RS. Resting state fMRI.
Prediction performance for other phenotypes
The out-of-sample prediction performance for seven other measures (1 in-scanner behavioral measure of 2-back trial accuracy, 3 cognitive and 3 measures related to psychopathology; Supplementary Table 2) beyond the total composite score from the NIH toolbox are shown in Supplementary Fig. 4, with corresponding replication sample size estimates to detect these effects with 80% power in Supplementary Fig. 5. In general, imaging measures (especially fMRI and structural MRI) were more predictive of cognitive variables than psychopathology, although psychopathology measures still benefit from multivariate methods, especially for prediction from ENb fMRI and surface area for a general “p” factor of psychopathology. The highest performance was achieved with ENb fMRI predicting 2-back trial accuracy with an r = 0.503, which would require only 29 subjects in a replication sample to detect with 80% power. This finding is consistent with our previous report of in-scanner task-relevant behavior having notably strong associations with fMRI, as compared to an out-of-scanner cognitive task (Zhao et al. 2023).
Specificity of task fMRI contrast for prediction
Finally, we show that the predictive power of task functional MRI is linked to the relevance of the chosen ENb contrast for the behavioral outcome (Supplementary Fig. 6). Specifically, we find that multivariate prediction of general cognition is much lower across the two non-working memory related contrasts (faces vs places: r = 0.126 + 0.051; emotional vs neutral faces r = 0.091 + 0.041) and for using 0-back trials only (r = 0.248 + 0.054), compared to using the 2- vs 0-back trial contrast as presented throughout the manuscript (r = 0.425 + 0.036).
Discussion
Our work demonstrates that by leveraging large datasets such as ABCD, reproducible brain-behavior associations can be measured with multivariate methods applied to structural and functional MRI in smaller replication samples (e.g. approximately 100 subjects) typical of many existing publications, grants, and databases. We find that a working-memory functional MRI task is particularly well-powered to predict general cognition in the baseline ABCD sample, with only ~ 41 subjects required to achieve 80% power, and this is further boosted to just 29 subjects when predicting a measure of performance on the fMRI task itself. Finally, we show that with 100 random samplings of just 100 subjects in the discovery sample, prediction can be adequately powered with just 66 subjects in the replication sample when using multivariate methods to predict cognition from working memory task-fMRI data. This work paints a much more optimistic landscape of opportunities offered by non-invasive MRI techniques across different imaging modalities with even several dozen subjects, particularly with targeted experimental designs and improved statistical analysis.
The boost in power afforded by multivariate as compared to univariate methods in measuring brain-behavior associations is well-documented (Sripada et al. 2020; Palmer et al. 2021; Zhao et al. 2021; Marek et al. 2022; Spisak et al. 2023). Associations between cognitive performance and neuroimaging phenotypes are particularly amenable to multivariate methods, given the distributed and sparse nature of these effects across the brain (Palmer et al. 2021; Zhao et al. 2021). Functional MRI analysis has long capitalized on observed strong patterns of spatial and temporal correlations across the brain (Derado et al. 2010). Structural imaging-derived phenotypes also have a strong covariance structure between regions (Lerch et al. 2006), likely due to gradients of core neurodevelopmental genetic factors shaping the cortex early in life (Rakic 1988, 2009; van der Meer et al. 2020; Makowski et al. 2022). In line with our previous work (Palmer et al. 2021), multivariate methods capturing distributed brain structural patterns explained a larger amount of variance in cognition compared to univariate mapping. We observed weak univariate effect sizes between structural/diffusion imaging measures and cognitive measures, with the lowest effects for intracortical restricted diffusion. However, and importantly, these small effects with sMRI and RS fMRI received substantial boosts with multivariate modeling. Our results emphasize the importance of taking into consideration structural and functional brain patterns as a whole in brain-behavior analyses, rather than analyzing any single vertex or region-of-interest in isolation. Although results were weaker overall with measures of psychopathology (e.g. internalizing and externalizing symptoms, p factor of psychopathology), these measures still benefited from a boost in prediction, particularly when predicted by fMRI and surface area, using multivariate methods. Generally, we also observed that surface area and task fMRI performed quite well for other cognitive measures, once again suggesting that replication sample sizes still only require on the order of hundreds, not thousands, of individuals for these imaging measures.
The notably high prediction performance of the ENb task on general cognition and accuracy on 2-back trials showcases the power of using a task-evoked functional MRI study design in predicting task-relevant behavior. Our group has previously shown that accuracy on 2-back trials was highly correlated with total composite cognition (Zhao et al. 2023), while performance on a motor inhibitory task exhibited little or no correlation with either cognitive measure. This behavioral correlation pattern was consistent with the greater prediction performance of the ENb task on total composite cognition, and the weak associations found with the motor inhibitory task. We also demonstrate that the choice of task fMRI contrast is an important variable in a predictive framework, whereby we only saw a boost in predictive performance with the 2- vs 0-back contrast, and not for other contrasts that do not engage working memory-related processes to the same extent. Although structural MRI and resting-state fMRI can be useful in mapping brain-behavior associations, our results do emphasize the advantage of using an active experimental functional brain imaging paradigm to improve predictive performance of behavior.
Similar to the structural MRI measures, we find that resting state fMRI predictors also receive a generous boost from multivariate prediction methods (r = 0.286 and 94 subjects to detect with 80% power for general cognition) compared to univariate (r = 0.116 and 584 subjects needed). Beyond general cognition, the resting state correlation matrix predicted other cognitive and psychopathology measures in a manner similar to cortical thickness predictors. However, our ENb task fMRI predictors still outperformed resting state fMRI across all behavioral outcomes. There was also a large degree of variability in resting state fMRI prediction across iterations, as can be seen by the larger adjusted standard deviation estimates, particularly for multivariate prediction. We also further emphasize in this work, concordant with recent work from our group (Zhao et al. 2023), that task fMRI outperforms resting state fMRI in predicting task-relevant behavior (i.e. accuracy on 2-back trials). Altogether, this suggests that low-dimensional patterns of resting-state correlations across the brain are more useful than any single pair-wise correlation on its own in predicting behavior. However, the absence of an actively engaging task with resting state fMRI may be contributing to much more heterogeneous performance metrics across different subsamples, compared with the more stable estimates derived from task fMRI. Finally, we found very poor performance of functional correlations between pre-defined networks that are frequently incorporated into neuroimaging analyses, calling into question the validity and biological interpretation of these networks when defined in independent samples.
We did not observe large boosts in effect sizes with diffusion MRI measures when comparing multivariate to univariate associations. RND within superficial white matter showed a slight boost, with 290 participants required in the replication sample to achieve 80% power in predicting cognition with multivariate methods, compared with 508 with univariate methods at the same level of power. Notably, RND, derived from restriction spectrum imaging modeling, benefited more from multivariate methods for prediction of general cognition compared to fractional anisotropy of superficial white matter. The slight improvement in performance of RND compared to FA is consistent with several reports that RSI measures, derived from multi-shell diffusion imaging acquisitions, may be more sensitive in capturing microstructural properties especially in the context of neurodevelopment (Palmer et al. 2022), and neurological and psychiatric disorders (Carper et al. 2016; Loi et al. 2016; Reas et al. 2018). For restricted isotropic diffusion intracortically, both methods still required over 1000 individuals. Although the current manuscript focused on peri-cortical associations (i.e. in and around the cortex), it cannot be ruled out that diffusion measures of other brain regions, that may be more reliably measured with MRI (e.g. deeper white matter tracts, subcortical structures), would still benefit from multivariate analyses. Future work extending multivariate analyses to voxel-wise prediction of cognitive and other behavioral phenotypes hypothesized to be more strongly associated with microstructure would be fruitful in testing this hypothesis.
The conclusion reaching many headlines that thousands of individuals are required to measure brain-behavior associations with structural and functional MRI (Marek et al. 2022) is based on the assumption that researchers are working within a univariate framework and sampling across a broad array of outcomes. This conclusion was also based largely on the poor performance of resting-state functional connectivity to predict cognition and other behaviors, a method that does not orient participants’ attention to any particular task or stimulus, and in turn, may not be the best candidate for predicting measures of cognition (Rosenberg and Finn 2022; Zhao et al. 2023). This “brain-wide association study” approach of sampling across a large array of behavioral outcomes with mass univariate analyses bears some resemblance to methods used in genome-wide association studies (GWAS). However, the application of multivariate methods helps ease the burden of multiple comparison corrections that mass univariate methods typically require. Instead, our findings highlight a different use case of a GWAS-like framework, where we can leverage a larger discovery sample, such as the one afforded by the ABCD Study, to define multivariate brain patterns associated with behavioral measures of interest, and in turn, inform findings in smaller samples. In this vein, our approach parallels that of the application of consortia-led GWAS to the derivation of polygenic risk scores in independent datasets, where large samples can help us obtain more precise predictive weights for out-of-sample prediction.
However, large “ABCD-like” samples are not always necessary if working with strong brain-behavior relationships to begin with. Here we highlight analyses testing out-of-sample prediction performance given different discovery sample sizes, showing that even with 100 random samplings of 50 subjects in the discovery sample, only ~ 100 subjects are required in replication to predict general cognition from task fMRI data using multivariate methods. It is important to note, however, that there is still large variability in prediction estimates across 100 iterations at smaller discovery samples. Additionally, integration of regularization methods in our multivariate prediction framework may have contributed to the well-powered results even in smaller discovery samples by reducing the chances of overfitting, leading to a more optimal model. This further emphasizes the fact that with the correct methodological choices, thousands of individuals are not always required in either discovery or replication samples in pursuit of meaningful and reproducible brain-behavior associations. This is particularly evident when predicting relevant in-scanner behavior (i.e. 2-back accuracy) from task activation during the ENb task, where only 29 replication subjects were required to assess this relationship with 80% power. Larger samples, however, are required for other weaker brain-behavior associations, for instance with internalizing and externalizing measures of psychopathology in ABCD.
We have previously shown in our own work that a notable portion of the variance attributed to imaging measures in predicting cognition is shared with sociodemographic variables (Zhao et al. 2023), reflecting the complex interplay between socioeconomic resources and other environmental factors, brain development and behavior. Others have also shown the importance of socioeconomic resources on brain-behavior relationships in models integrating both structural (Thomas and Coecke 2023; Farah 2017; Brito and Noble 2014; Raizada and Kishiyama 2010) and functional (Tomalski et al. 2013; Tomasi and Volkow 2023; Demir et al. 2015) imaging modalities. Sociodemographic factors capture a complex array of variables that differentially and jointly influence brain structure. For instance, in a large developmental sample of youth between the ages of 3 and 20 years, parental education and family income were non-linearly associated with cortical surface area, with most pronounced effects at lower income levels and in heteromodal brain regions, such as frontal and temporal areas important for language and memory (Noble et al. 2015). Socioeconomic resources are also hypothesized to modulate neurodevelopmental trajectories (Thomas and Coecke 2023), where evidence has suggested altered development of gray matter (Hanson et al. 2013), cortical thickness (Piccolo et al. 2016) and myelin-based markers (Ziegler et al. 2020) with age as a function of socioeconomic factors. These neuroanatomical and functional relationships with variables such as poverty levels, household income, and parental education may be an integrated result of the impact of socioeconomic resources on cognition in youth, reflected through both neural and behavioral mechanisms (Ursache and Noble 2016). We acknowledge that socioeconomic status is a highly complex, multi-dimensional construct that would require the inclusion of a larger array of environmental, community-based and developmental measurements to better understand its influence on cognition, which could form the basis for future work using the ABCD Study dataset.
The included age range of participants in this work (ages 9–11 years) marks a time of dynamic development with respect to both neurocognition and brain maturation, captured in part by our MRI-based cortical measures. Alterations in synaptic density within the cortical mantle are intricately linked with cognitive development (Rakic et al. 1994; Petanjek et al. 2023; Petanjek et al. 2011). Sex differences in cortical trajectories with age have also been shown putatively linked to differences in synaptic and dendritic architecture (Duerden et al. 2019). Although we only focused on a single timepoint and pooled across the sexes to remain consistent with other recent work in this domain, it will be important to integrate incoming longitudinal data from the ABCD Study, to elucidate if any imaging modalities or brain patterns may have more predictive power of cognition in a neurodevelopmental context. Sex-dependent maturational patterns may also yield important clues for cognitive performance and neuropsychiatric measures that show sex differentiation.
We recognize that although effects were strongest with task fMRI compared to other imaging modalities, the included sample of 5,673 individuals may not generalize to the full sociodemographic spread of the ABCD baseline sample. Similarly, our sample with recommended resting state fMRI data for inclusion (n = 5,321) represented the smallest sample of all of the imaging modalities. We aimed to stay as consistent as possible with other recent work testing the reproducibility and power of brain-behavior associations with neuroimaging, and restricted our covariates to age, sex, and scanner type. However, future investigations would benefit from a deeper understanding of the impact of sociodemographic and environmental factors in behavioral prediction paradigms, as discussed above. The brain-behavior associations reported here may not generalize to older adolescents or adults, given the age range of the included ABCD baseline sample. Future work is encouraged to integrate longitudinal data from ABCD to boost effect sizes of brain-behavior associations (Kang et al. 2023), as well as integrate independent datasets from different developmental stages for broader generalization and external validation. Given the relatively weaker predictive power of resting-state fMRI compared to task fMRI for cognition shown both in this work and others (Zhao et al. 2021; Marek et al. 2022), there has been increased dialogue surrounding a potential paradigm shift from resting state to task-based functional MRI measures (Greene et al. 2018). Mental health-related phenotypes are of particular interest in adolescent samples, but show weaker effects with brain structure and function in ABCD Study data compared to general cognition. Future directions would benefit from a focus on modeling of behavioral phenotypes to improve precision behavioral phenotyping (Tiego et al. 2023). It will also be important to integrate independent datasets for external validation. Finally, recommendations have been made to steer away from single modeling approaches and understand how various models (e.g. mixture modeling) (Greene et al. 2022) could better capture the complex relationships between brain and behavior reflected in large diverse datasets such as ABCD.
We show that reproducible brain-behavior associations can be obtained with dozens, rather than thousands, of individuals, helping to quell growing concerns of the demise of reproducible results with neuroimaging. Our findings help shed clarity on the utility of neuroimaging studies, particularly for understanding normative and aberrant neurodevelopment, and present a more hopeful view for future funding priorities of smaller neuroimaging studies and policy decisions.
Supplementary Material
Acknowledgments
The authors would like to thank the research participants and staff involved in data collection of the Adolescent Brain Cognitive Development (ABCD) Study data.
Contributor Information
Carolina Makowski, Center for Multimodal Imaging and Genetics, University of California San Diego, La Jolla, CA, United States; Department of Radiology, University of California San Diego, La Jolla, CA, United States.
Timothy T Brown, Department of Neurosciences, University of California San Diego, La Jolla, CA,, United States.
Weiqi Zhao, Center for Multimodal Imaging and Genetics, University of California San Diego, La Jolla, CA, United States; Department of Cognitive Science, University of California San Diego, La Jolla, CA, United States.
Donald J Hagler Jr, Center for Multimodal Imaging and Genetics, University of California San Diego, La Jolla, CA, United States; Department of Radiology, University of California San Diego, La Jolla, CA, United States.
Pravesh Parekh, NORMENT, Division of Mental Health and Addiction, Oslo University Hospital & Institute of Clinical Medicine, University of Oslo, Oslo, Norway.
Hugh Garavan, Department of Psychiatry, University of Vermont, Burlington, VT, United States.
Thomas E Nichols, Nuffield Department of Clinical Neurosciences, University of Oxford, Oxford, United Kingdom; Wellcome Centre for Integrative Neuroimaging, FMRIB, Nuffield Department of Clinical Neurosciences, University of Oxford, Oxford, United Kingdom.
Terry L Jernigan, Department of Cognitive Science, University of California San Diego, La Jolla, CA, United States.
Anders M Dale, Center for Multimodal Imaging and Genetics, University of California San Diego, La Jolla, CA, United States; Department of Radiology, University of California San Diego, La Jolla, CA, United States; Department of Neurosciences, University of California San Diego, La Jolla, CA,, United States.
Author contributions
Carolina Makowski (Conceptualization, Data curation, Formal analysis, Investigation, Project administration, Validation, Visualization, Writing—original draft, Writing—review & editing), Timothy T. Brown (Conceptualization, Writing—review & editing), Weiqi Zhao (Data curation, Methodology, Writing—review & editing), Donald J. Hagler (Data curation, Software, Writing—review & editing), Pravesh Parekh (Methodology, Writing—review & editing), Hugh Garavan (Writing—review & editing), Thomas Nichols (Methodology, Writing—review & editing), Terry Jernigan (Conceptualization, Investigation, Project administration, Writing—review & editing), Anders Dale (Conceptualization, Data curation, Formal analysis, Funding acquisition, Investigation, Methodology, Project administration, Resources, Software, Supervision, Validation, Visualization, Writing—review & editing).
Funding
Data used in the preparation of this article were obtained from the Adolescent Brain Cognitive DevelopmentSM (ABCD) Study (https://abcdstudy.org), held in the NIMH Data Archive (NDA). This is a multisite, longitudinal study designed to recruit more than 10,000 children age 9–10 and follow them over 10 years into early adulthood. The ABCD Study is supported by the National Institutes of Health (NIH) and additional federal partners under award numbers U01DA041048, U01DA050989, U01DA051016, U01DA041022, U01DA051018, U01DA051037, U01DA050987, U01DA041174, U01DA041106, U01DA041117, U01DA041028, U01DA041134, U01DA050988, U01DA051039, U01DA041156, U01DA041025, U01DA041120, U01DA051038, U01DA041148, U01DA041093, U01DA041089, U24DA041123, and U24DA041147. A full list of supporters is available at https://abcdstudy.org/federal-partners.html. A listing of participating sites and a complete listing of the study investigators can be found at https://abcdstudy.org/study- sites/. ABCD consortium investigators designed and implemented the study and/or provided data but did not necessarily all participate in analysis or writing of this report. This manuscript reflects the views of the authors and may not reflect the opinions or views of the NIH or ABCD consortium investigators. The ABCD data repository grows and changes over time. Data were drawn from the NIMH Data Archive ABCD Collection Release 4.0 (DOI: 10.15154/1523041).
Additionally, this work was supported by the National Institutes of Mental Health, award number (K99MH132886 to C.M.), the European Union’s Horizon 2020 research and innovation programme under the Marie Skłodowska-Curie grant agreement (number 801133 to P.P.), and the Research Council of Norway (grant number 324252 to P.P.).
Conflict of interest statement: Dr Dale reports that he was a Founder of and holds equity in CorTechs Labs, Inc., and serves on its Scientific Advisory Board. He is a member of the Scientific Advisory Board of Human Longevity, Inc. He receives funding through research grants from GE Healthcare to UCSD. The terms of these arrangements have been reviewed by and approved by UCSD in accordance with its conflict of interest policies. Dr Dale also reports that he has memberships with the following research consortia: Alzheimer’s Disease Genetics Consortium (ADGC); Enhancing Neuro Imaging Genetics Through Meta Analysis (ENIGMA); Prostate Cancer Association Group to Investigate Cancer Associated Alterations in the Genome (PRACTICAL); Psychiatric Genomics Consortium (PGC). All other authors have no conflicts of interest.
References
- Bandettini PA, Gonzalez-Castillo J, Handwerker D, Taylor P, Chen G, Thomas A. The challenge of BWAs: unknown unknowns in feature space and variance. Med. 2022:3(8):526–531. 10.1016/j.medj.2022.07.002. [DOI] [PubMed] [Google Scholar]
- Barch DM, Burgess GC, Harms MP, Petersen SE, Schlaggar BL, Corbetta M, Glasser MF, Curtiss S, Dixit S, Feldt C, et al. Function in the human connectome: task-fMRI and individual differences in behavior. NeuroImage. 2013:80:169–189. 10.1016/j.neuroimage.2013.05.033. [DOI] [PMC free article] [PubMed] [Google Scholar]
- Bondy WH, Zlot W. The standard error of the mean and the difference between means for finite populations. Am Stat. 1976:30(2):96–97. 10.1080/00031305.1976.10479149. [DOI] [Google Scholar]
- Brito NH, Noble KG. Socioeconomic status and structural brain development. Front Neurosci. 2014:8:276. 10.3389/fnins.2014.00276. [DOI] [PMC free article] [PubMed] [Google Scholar]
- Carper RA, Treiber JM, White NS, Kohli JS, Müller R-A. Restriction spectrum imaging as a potential measure of cortical neurite density in autism. Front Neurosci. 2016:10:610. 10.3389/fnins.2016.00610. [DOI] [PMC free article] [PubMed] [Google Scholar]
- Casey BJ, Cannonier T, Conley MI, Cohen AO, Barch DM, Heitzeg MM, Soules ME, Teslovich T, Dellarco DV, Garavan H, et al. The adolescent brain cognitive development (ABCD) study: imaging acquisition across 21 sites. Dev Cogn Neurosci. 2018:32:43–54. 10.1016/j.dcn.2018.03.001. [DOI] [PMC free article] [PubMed] [Google Scholar]
- Cecchetti L, Handjaras G. Reproducible brain-wide association studies do not necessarily require thousands of individuals. PsyArXiv. 2022. 10.31234/osf.io/c8xwe. [DOI]
- Chaarani B, Hahn S, Allgaier N, Adise S, Owens MM, Juliano AC, Yuan DK, Loso H, Ivanciu A, Albaugh MD, et al. Baseline brain function in the preadolescents of the ABCD study. Nat Neurosci. 2021:24(8):1176–1186. 10.1038/s41593-021-00867-9. [DOI] [PMC free article] [PubMed] [Google Scholar]
- Chakravarty MM. Controversies on brain-wide association studies: commentaries from the field. Aperture Neuro. 2022:2:1. 10.52294/fb60878a-5ee2-44cf-a6a9-9cdcc2f1c397. [DOI] [Google Scholar]
- Chen J, Tam A, Kebets V, Orban C, Ooi LQR, Asplund CL, Marek S, Dosenbach NUF, Eickhoff SB, Bzdok D, et al. Shared and unique brain network features predict cognitive, personality, and mental health scores in the ABCD study. Nat Commun. 2022:13(1):2217. 10.1038/s41467-022-29766-8. [DOI] [PMC free article] [PubMed] [Google Scholar]
- Clark DA, Hicks BM, Angstadt M, Rutherford S, Taxali A, Hyde L, Weigard A, Heitzeg MM, Sripada C. The general factor of psychopathology in the adolescent brain cognitive development (ABCD) study: a comparison of alternative modeling approaches. Clin Psychol Sci. 2021:9(2):169–182. 10.1177/2167702620959317. [DOI] [PMC free article] [PubMed] [Google Scholar]
- Cognitive neuroscience at the crossroads . Cognitive neuroscience at the crossroads. Nature. 2022:608(7924):647. 10.1038/d41586-022-02283-w. [DOI] [PubMed] [Google Scholar]
- Cohen AO, Breiner K, Steinberg L, Bonnie RJ, Scott ES, Taylor-Thompson KA, Rudolph MD, Chein J, Richeson JA, Heller AS, et al. When is an adolescent an adult? Assessing cognitive control in emotional and nonemotional contexts. Psychol Sci. 2016:27(4):549–562. 10.1177/0956797615627625. [DOI] [PubMed] [Google Scholar]
- Demir ÖE, Prado J, Booth JR. Parental socioeconomic status and the neural basis of arithmetic: differential relations to verbal and visuo-spatial representations. Dev Sci. 2015:18(5):799–814. 10.1111/desc.12268. [DOI] [PMC free article] [PubMed] [Google Scholar]
- Derado G, Bowman FD, Kilts CD. Modeling the spatial and temporal dependence in FMRI data. Biometrics. 2010:66(3):949–957. 10.1111/j.1541-0420.2009.01355.x. [DOI] [PMC free article] [PubMed] [Google Scholar]
- Deyoung CG, Sassenberg TA, Abend R, Allen TA, Beaty RE, Bellgrove MA, Blain SD, Bzdok D, Chavez RS, Engel SA, et al. Reproducible between-person brain-behavior associations do not always require thousands of individuals. PsyArXiv. 2022. 10.31234/osf.io/sfnmk. [DOI]
- Dick AS, Lopez DA, Watts AL, Heeringa S, Reuter C, Bartsch H, Fan CC, Kennedy DN, Palmer C, Marshall A, et al. Meaningful associations in the adolescent brain cognitive development study. NeuroImage. 2021:239:118262. 10.1016/j.neuroimage.2021.118262. [DOI] [PMC free article] [PubMed] [Google Scholar]
- Duerden EG, Chakravarty MM, Lerch JP, Taylor MJ. Sex-based differences in cortical and subcortical development in 436 individuals aged 4–54 years. Cereb Cortex. 2019:30(5):2854–2866. 10.1093/cercor/bhz279. [DOI] [PMC free article] [PubMed] [Google Scholar]
- Elliott ML, Knodt AR, Ireland D, Morris ML, Poulton R, Ramrakha S, Sison ML, Moffitt TE, Caspi A, Hariri AR. What is the test-retest reliability of common task-functional MRI measures? New empirical evidence and a meta-analysis. Psychol Sci. 2020:31(7):792–806. 10.1177/0956797620916786. [DOI] [PMC free article] [PubMed] [Google Scholar]
- Farah MJ. The neuroscience of socioeconomic status: correlates, causes, and consequences. Neuron. 2017:96(1):56–71. 10.1016/j.neuron.2017.08.034. [DOI] [PubMed] [Google Scholar]
- Finn ES, Bandettini PA. Movie-watching outperforms rest for functional connectivity-based prediction of behavior. NeuroImage. 2021:235:117963. 10.1016/j.neuroimage.2021.117963. [DOI] [PMC free article] [PubMed] [Google Scholar]
- Garavan H, Bartsch H, Conway K, Decastro A, Goldstein RZ, Heeringa S, Jernigan T, Potter A, Thompson W, Zahs D. Recruiting the ABCD sample: design considerations and procedures. Dev Cogn Neurosci. 2018:32:16–22. 10.1016/j.dcn.2018.04.004. [DOI] [PMC free article] [PubMed] [Google Scholar]
- Gell M, Eickhoff SB, Omidvarnia A, Küppers V, Patil KR, Satterthwaite TD, Müller VI, Langner R. The burden of reliability: how measurement noise limits brain-behaviour predictions. bioRxiv. 2024. 10.1101/2023.02.09.527898. [DOI] [PMC free article] [PubMed]
- Gordon EM, Laumann TO, Adeyemo B, Huckins JF, Kelley WM, Petersen SE. Generation and evaluation of a cortical area parcellation from resting-state correlations. Cereb Cortex. 2016:26(1):288–303. 10.1093/cercor/bhu239. [DOI] [PMC free article] [PubMed] [Google Scholar]
- Gratton C, Nelson SM, Gordon EM. Brain-behavior correlations: two paths toward reliability. Neuron. 2022:110(9):1446–1449. 10.1016/j.neuron.2022.04.018. [DOI] [PubMed] [Google Scholar]
- Greene AS, Gao S, Scheinost D, Constable RT. Task-induced brain state manipulation improves prediction of individual traits. Nat Commun. 2018:9(1):2807. 10.1038/s41467-018-04920-3. [DOI] [PMC free article] [PubMed] [Google Scholar]
- Greene AS, Shen X, Noble S, Horien C, Hahn CA, Arora J, Tokoglu F, Spann MN, Carrión CI, Barron DS, et al. Brain–phenotype models fail for individuals who defy sample stereotypes. Nature. 2022:609(7925):109–118. 10.1038/s41586-022-05118-w. [DOI] [PMC free article] [PubMed] [Google Scholar]
- Hagler DJ Jr, Hatton S, Cornejo MD, Makowski C, Fair DA, Dick AS, Sutherland MT, Casey BJ, Barch DM, Harms MP, et al. Image processing and analysis methods for the adolescent brain cognitive development study. NeuroImage. 2019:202:116091. 10.1016/j.neuroimage.2019.116091. [DOI] [PMC free article] [PubMed] [Google Scholar]
- Hanson JL, Hair N, Shen DG, Shi F, Gilmore JH, Wolfe BL, Pollak SD. Family poverty affects the rate of human infant brain growth. PLoS One. 2013:8(12):e80954. 10.1371/journal.pone.0080954. [DOI] [PMC free article] [PubMed] [Google Scholar]
- Hulley SB, Cummings SR, Browner WS, Grady DG, Newman TB. Designing clinical research. Philadelphia, PA: Lippincott Williams & Wilkins; 2013. [Google Scholar]
- Jiang R, Zuo N, Ford JM, Qi S, Zhi D, Zhuo C, Xu Y, Fu Z, Bustillo J, Turner JA, et al. Task-induced brain connectivity promotes the detection of individual differences in brain-behavior relationships. NeuroImage. 2020:207:116370. 10.1016/j.neuroimage.2019.116370. [DOI] [PMC free article] [PubMed] [Google Scholar]
- Kang K, Seidlitz J, Bethlehem RAI, Schildcrout J, Tao R, Xiong J, Jones MT, Lifespan Brain Chart Consortium, 3R-BRAIN, AIBL, Alzheimer’s Disease Neuroimaging Initiative, Alzheimer’s Disease Repository Without Borders Investigators, CCNP, COBRE, cVEDA, Harvard Aging Brain Study, IMAGEN, POND, The PREVENT-AD Research Group, Alexander-Bloch A, et al. Study design features that improve effect sizes in cross-sectional and longitudinal brain-wide association studies. bioRxiv. 2024. 10.1101/2023.05.29.542742. [DOI]
- Kardan O, Stier AJ, Cardenas-Iniguez C, Schertz KE, Pruin JC, Deng Y, Chamberlain T, Meredith WJ, Zhang X, Bowman JE, et al. Differences in the functional brain architecture of sustained attention and working memory in youth and adults. PLoS Biol. 2022:20(12):e3001938. 10.1371/journal.pbio.3001938. [DOI] [PMC free article] [PubMed] [Google Scholar]
- Kelly RE Jr, Hoptman MJ. Replicability in brain imaging. Brain Sci. 2022:12(3):397. 10.3390/brainsci12030397. [DOI] [PMC free article] [PubMed] [Google Scholar]
- Kennedy JT, Harms MP, Korucuoglu O, Astafiev SV, Barch DM, Thompson WK, Bjork JM, Anokhin AP. Reliability and stability challenges in ABCD task fMRI data. NeuroImage. 2022:252:119046. 10.1016/j.neuroimage.2022.119046. [DOI] [PMC free article] [PubMed] [Google Scholar]
- Kong X-Z, Zhang C, Liu Y, Pu Y. Scanning reproducible brain-wide associations: sample size is all you need? Psychoradiology. 2022:2(3):67–68. 10.1093/psyrad/kkac010. [DOI] [PMC free article] [PubMed] [Google Scholar]
- Lerch JP, Worsley K, Shaw WP, Greenstein DK, Lenroot RK, Giedd J, Evans AC. Mapping anatomical correlations across cerebral cortex (MACACC) using cortical thickness from MRI. NeuroImage. 2006:31(3):993–1003. 10.1016/j.neuroimage.2006.01.042. [DOI] [PubMed] [Google Scholar]
- Liu S, Abdellaoui A, Verweij KJH, Wingen GA. Replicable brain-phenotype associations require large-scale neuroimaging data. Nat Hum Behav. 2023:7(8):1344–1356. 10.1038/s41562-023-01642-5. [DOI] [PubMed] [Google Scholar]
- Loi RQ, Leyden KM, Balachandra A, Uttarwar V, Hagler DJ Jr, Paul BM, Dale AM, White NS, McDonald CR. Restriction spectrum imaging reveals decreased neurite density in patients with temporal lobe epilepsy. Epilepsia. 2016:57(11):1897–1906. 10.1111/epi.13570. [DOI] [PMC free article] [PubMed] [Google Scholar]
- Luciana M, Bjork JM, Nagel BJ, Barch DM, Gonzalez R, Nixon SJ, Banich MT. Adolescent neurocognitive development and impacts of substance use: overview of the adolescent brain cognitive development (ABCD) baseline neurocognition battery. Dev Cogn Neurosci. 2018:32:67–79. 10.1016/j.dcn.2018.02.006. [DOI] [PMC free article] [PubMed] [Google Scholar]
- Makowski C, Meer D, Dong W, Wang H, Wu Y, Zou J, Liu C, Rosenthal SB, Hagler DJ Jr, Fan CC, et al. Discovery of genomic loci of the human cerebral cortex using genetically informed brain atlases. Science. 2022:375(6580):522–528. 10.1126/science.abe8457. [DOI] [PMC free article] [PubMed] [Google Scholar]
- Marek S, Tervo-Clemmens B, Calabro FJ, Montez DF, Kay BP, Hatoum AS, Donohue MR, Foran W, Miller RL, Hendrickson TJ, et al. Reproducible brain-wide association studies require thousands of individuals. Nature. 2022:603(7902):654–660. 10.1038/s41586-022-04492-9. [DOI] [PMC free article] [PubMed] [Google Scholar]
- Noble KG, Houston SM, Brito NH, Bartsch H, Kan E, Kuperman JM, Akshoomoff N, Amaral DG, Bloss CS, Libiger O, et al.. Family income, parental education and brain structure in children and adolescents. Nat Neurosci. 2015:18(5):773–778. 10.1038/nn.3983. [DOI] [PMC free article] [PubMed] [Google Scholar]
- Omidvarnia A, Sasse L, Larabi DI, Raimondo F, Hoffstaedter F, Kasper J, Dukart J, Petersen M, Cheng B, Thomalla G, et al. Is resting state fMRI better than individual characteristics at predicting cognition? bioRxiv. 2023. 10.1101/2023.02.18.529076. [DOI] [PMC free article] [PubMed]
- Palmer CE, Zhao W, Loughnan R, Zou J, Fan CC, Thompson WK, Dale AM, Jernigan TL. Distinct regionalization patterns of cortical morphology are associated with cognitive performance across different domains. Cereb Cortex. 2021:31(8):3856–3871. 10.1093/cercor/bhab054. [DOI] [PMC free article] [PubMed] [Google Scholar]
- Palmer CE, Pecheva D, Iversen JR, Hagler DJ Jr, Sugrue L, Nedelec P, Fan CC, Thompson WK, Jernigan TL, Dale AM. Microstructural development from 9 to 14 years: evidence from the ABCD study. Dev Cogn Neurosci. 2022:53:101044. 10.1016/j.dcn.2021.101044. [DOI] [PMC free article] [PubMed] [Google Scholar]
- Petanjek Z, Banovac I, Sedmak D, Hladnik A.. Dendritic spines: synaptogenesis and synaptic pruning for the developmental organization of brain circuits. Adv Neurobiol. 2023:34:143–221. 10.1007/978-3-031-36159-3_4. [DOI] [PubMed] [Google Scholar]
- Petanjek Z, Judaš M, Šimic G, Rasin MR, Uylings HBM, Rakic P, Kostovic I. Extraordinary neoteny of synaptic spines in the human prefrontal cortex. Proc Natl Acad Sci U S A. 2011:108(32):13281–13286. 10.1073/pnas.1105108108. [DOI] [PMC free article] [PubMed] [Google Scholar]
- Piccolo LR, Merz EC, He X, Sowell ER, Noble KG, Pediatric Imaging, Neurocognition, Genetics Study. Age-related differences in cortical thickness vary by socioeconomic status. PLoS One. 2016:11(9):e0162511. 10.1371/journal.pone.0162511. [DOI] [PMC free article] [PubMed] [Google Scholar]
- Raizada R, Kishiyama M. Effects of socioeconomic status on brain development, and how cognitive neuroscience may contribute to leveling the playing field. Front Hum Neurosci. 2010:4:3. 10.3389/neuro.09.003.2010. [DOI] [PMC free article] [PubMed] [Google Scholar]
- Rakic P. Specification of cerebral cortical areas. Science. 1988:241(4862):170–176. 10.1126/science.3291116. [DOI] [PubMed] [Google Scholar]
- Rakic P. Evolution of the neocortex: a perspective from developmental biology. Nat Rev Neurosci. 2009:10(10):724–735. 10.1038/nrn2719. [DOI] [PMC free article] [PubMed] [Google Scholar]
- Rakic P, Bourgeois JP, Goldman-Rakic PS. Synaptic development of the cerebral cortex: implications for learning, memory, and mental illness. Prog Brain Res. 1994:102:227–243. 10.1016/S0079-6123(08)60543-9. [DOI] [PubMed] [Google Scholar]
- Reas ET, Hagler DJ Jr, White NS, Kuperman JM, Bartsch H, Wierenga CE, Galasko D, Brewer JB, Dale AM, McEvoy LK. Microstructural brain changes track cognitive decline in mild cognitive impairment. Neuroimage Clin. 2018:20:883–891. 10.1016/j.nicl.2018.09.027. [DOI] [PMC free article] [PubMed] [Google Scholar]
- Revisiting doubt in neuroimaging research . Revisiting doubt in neuroimaging research. Nat Neurosci. 2022:25(7):833–834. 10.1038/s41593-022-01125-2. [DOI] [PubMed] [Google Scholar]
- Rosenberg MD, Finn ES. How to establish robust brain–behavior relationships without thousands of individuals. Nat Neurosci. 2022:25(7):835–837. 10.1038/s41593-022-01110-9. [DOI] [PubMed] [Google Scholar]
- Rosenberg MD, Finn ES, Scheinost D, Papademetris X, Shen X, Constable RT, Chun MM. A neuromarker of sustained attention from whole-brain functional connectivity. Nat Neurosci. 2016:19(1):165–171. 10.1038/nn.4179. [DOI] [PMC free article] [PubMed] [Google Scholar]
- Spisak T, Bingel U, Wager TD. Multivariate BWAS can be replicable with moderate sample sizes. Nature. 2023:615(7951):E4–E7. 10.1038/s41586-023-05745-x. [DOI] [PMC free article] [PubMed] [Google Scholar]
- Sripada C, Rutherford S, Angstadt M, Thompson WK, Luciana M, Weigard A, Hyde LH, Heitzeg M. Prediction of neurocognition in youth from resting state fMRI. Mol Psychiatry. 2020:25(12):3413–3421. 10.1038/s41380-019-0481-6. [DOI] [PMC free article] [PubMed] [Google Scholar]
- Thomas MSC, Coecke S. Associations between socioeconomic status, cognition, and brain structure: evaluating potential causal pathways through mechanistic models of development. Cogn Sci. 2023:47(1):e13217. 10.1111/cogs.13217. [DOI] [PubMed] [Google Scholar]
- Tiego J, Fornito A. Putting behaviour back into brain-behaviour correlation analyses. Aperture Neuro, BWAS Editorials. 2022:1–4. [Google Scholar]
- Tiego J, Martin EA, CG DY, Hagan K, Cooper SE, Pasion R, Satchell L, Shackman AJ, Bellgrove MA, Fornito A, et al. Precision behavioral phenotyping as a strategy for uncovering the biological correlates of psychopathology. Nat Ment Health. 2023:1(5):304–315. 10.1038/s44220-023-00057-5. [DOI] [PMC free article] [PubMed] [Google Scholar]
- Tomalski P, Moore DG, Ribeiro H, Axelsson EL, Murphy E, Karmiloff-Smith A, Johnson MH, Kushnerenko E. Socioeconomic status and functional brain development - associations in early infancy. Dev Sci. 2013:16(5):676–687. 10.1111/desc.12079. [DOI] [PubMed] [Google Scholar]
- Tomasi D, Volkow ND. Effects of family income on brain functional connectivity in US children: associations with cognition. Mol Psychiatry. 2023:28(10):4195–4202. 10.1038/s41380-023-02222-9. [DOI] [PubMed] [Google Scholar]
- Uddin LQ. Brain–behavior associations depend heavily on user-defined criteria. Aperture Neuro. 2023:2:1–2. [Google Scholar]
- Ursache A, Noble KG. Neurocognitive development in socioeconomic context: Multiple mechanisms and implications for measuring socioeconomic status. Psychophysiology. 2016:53(1):71–82. 10.1111/psyp.12547. [DOI] [PMC free article] [PubMed] [Google Scholar]
- Valk SL, Hettwer M. Commentary on ‘reproducible brain-wide association studies require thousands of individuals. Aperture Neuro. 2022:2:1–2. [Google Scholar]
- Meer D, Frei O, Kaufmann T, Shadrin AA, Devor A, Smeland OB, Thompson WK, Fan CC, Holland D, Westlye LT, et al. Understanding the genetic determinants of the brain with MOSTest. Nat Commun. 2020:11(1):3512. 10.1038/s41467-020-17368-1. [DOI] [PMC free article] [PubMed] [Google Scholar]
- Volkow ND, Koob GF, Croyle RT, Bianchi DW, Gordon JA, Koroshetz WJ, Pérez-Stable EJ, Riley WT, Bloch MH, Conway K, et al. The conception of the ABCD study: from substance use to a broad NIH collaboration. Dev Cogn Neurosci. 2018:32:4–7. 10.1016/j.dcn.2017.10.002. [DOI] [PMC free article] [PubMed] [Google Scholar]
- Wechsler D. Wechsler intelligence scale for children. MN: Bloomington; 2014. [Google Scholar]
- White NS, Leergaard TB, D’Arceuil H, Bjaalie JG, Dale AM. Probing tissue microstructure with restriction spectrum imaging: histological and theoretical validation. Hum Brain Mapp. 2013:34(2):327–346. 10.1002/hbm.21454. [DOI] [PMC free article] [PubMed] [Google Scholar]
- Zhao W, Palmer CE, Thompson WK, Chaarani B, Garavan HP, Casey BJ, Jernigan TL, Dale AM, Fan CC. Individual differences in cognitive performance are better predicted by global rather than localized BOLD activity patterns across the cortex. Cereb Cortex. 2021:31(3):1478–1488. 10.1093/cercor/bhaa290. [DOI] [PMC free article] [PubMed] [Google Scholar]
- Zhao W, Makowski C, Hagler DJ, Garavan HP, Thompson WK, Greene DJ, Jernigan TL, Dale AM. Task fMRI paradigms may capture more behaviorally relevant information than resting-state functional connectivity. NeuroImage. 2023:270:119946. 10.1016/j.neuroimage.2023.119946. [DOI] [PMC free article] [PubMed] [Google Scholar]
- Ziegler G, Moutoussis M, Hauser TU, Fearon P, Bullmore ET, Goodyer IM, Fonagy P, Jones PB, Lindenberger U, Dolan RJ. Childhood socio-economic disadvantage predicts reduced myelin growth across adolescence and young adulthood. Hum Brain Mapp. 2020:41(12):3392–3402. 10.1002/hbm.25024. [DOI] [PMC free article] [PubMed] [Google Scholar]
Associated Data
This section collects any data citations, data availability statements, or supplementary materials included in this article.