


FIG. 4.
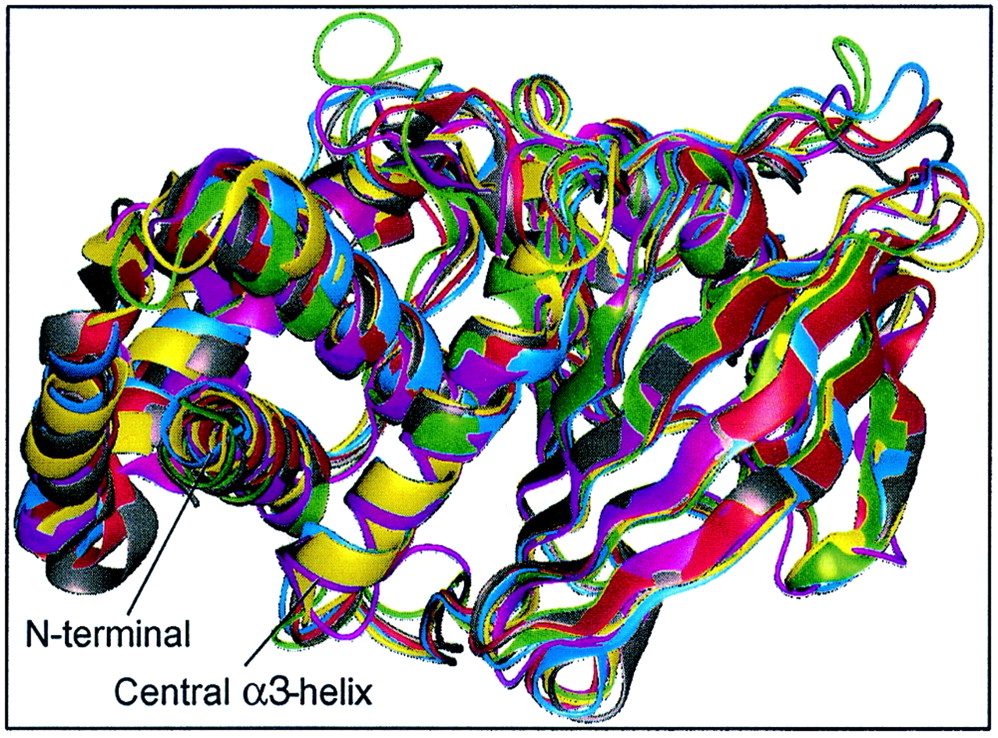
Crystal structures of vertebrate PTP domains show conserved fold and consistent Cα-backbone trace. PTP1B (magenta), RPTPα (gray), RPTPμ (red), LAR (blue), SHP1 (green), and SHP2 (yellow) were aligned and superimposed using Quanta (Molecular Simulations Inc.). For clarity, residues 280 to 298 (C terminal) of PTP1B, 250 to 281 (N terminal) and 522 to 532 (C terminal) of SHP1, and 2 to 218 (N terminal) of SHP2 were omitted from the figure, as well as D2 of LAR. The calculated RMS deviations between all Cα atoms between PTP1B and other PTPs are as follows: PTPα, 1.35 Å; RPTPμ, 2.72 Å; LAR D1, 2.78 Å; SHP1, 3.14 Å; and SHP2, 2.74 Å. For comparison, the RMS deviation between domains D1 and D2 of LAR is 1.3 Å. The X-ray structures are compared in their native open conformation.