


Fig. 2.
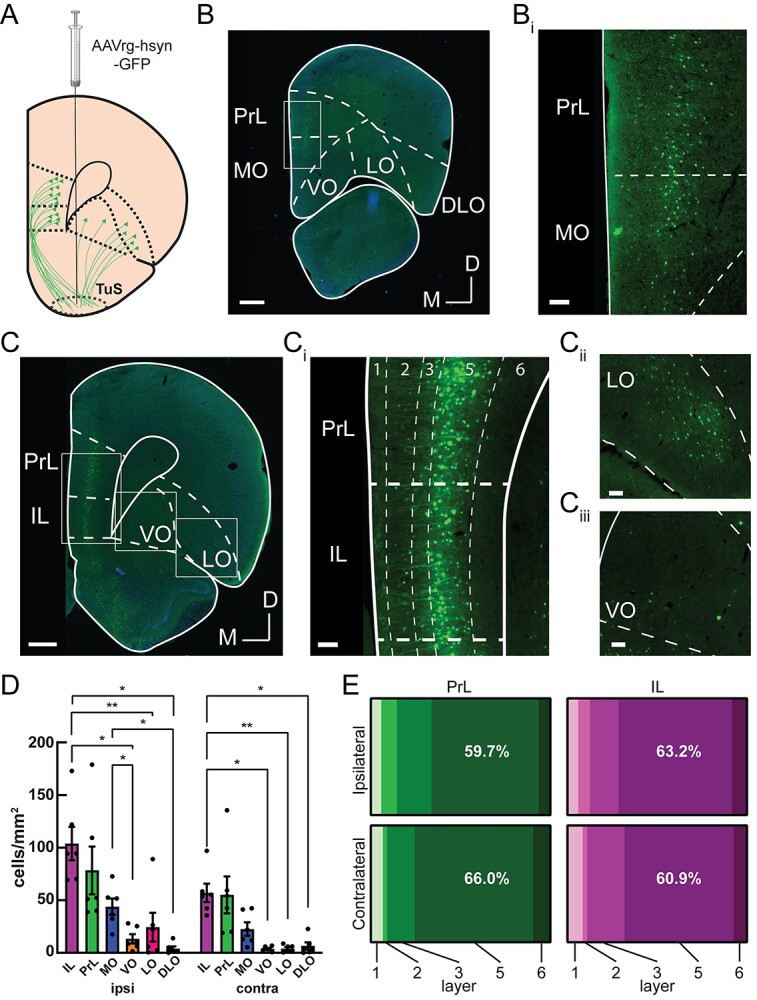
Among prefrontal cortex subregions, layer 5 prelimbic and infralimbic neurons provide the densest input to the tubular striatum. A) The TuS was injected with AAVrg-hsyn-GFP to identify TuS-projecting neurons throughout the prefrontal cortex. B) Representative mPFC image at Bregma +4.2 mm, showing GFP-labeled TuS-projecting neurons. Boxed region is indicated in panel Bi. Scale bar 500 μm. Bi). Magnified view of the boxed region in panel Bi. Scale bar 100 μm. C) Representative PFC image at Bregma +3.2 mm, showing GFP-labeled TuS-projecting neurons. Scale bar 500 μm. Ci) Magnified view of boxed region in panel C showing the PrL and IL cortices. Dotted lines indicate layers. Scale bar 100 μm. Cii) Magnified view of boxed region showing LO cortex. Scale bar 100 μm. Ciii) Magnified view of boxed region showing VO cortex. Scale bar 100 μm. n = 6 rats. D) Quantification of cell numbers across prefrontal cortex regions ipsilateral and contralateral to the injection site. Two-way ANOVA, main effect of hemisphere, F(1, 5) = 18.23, P = 0.0079, main effect of region, F(1.364, 6.818) = 15.74, P = 0.0041. Asterisks indicate results of Tukey’s multiple comparisons test, *P < 0.05, **P < 0.01. Error bars represent SEM. E) Distribution of cell bodies across PrL and IL layers, in both the contralateral and ipsilateral hemispheres, showing the majority of cell bodies are found in layer 5. PrL: Two-way ANOVA, main effect of layer F(1.15, 5.76) = 11.48, P = 0.014. IL: Two-way ANOVA, main effect of layer F(1.32, 6.61) = 42.55, P = 0.0003; main effect of hemisphere F(1,5) = 34.39, P = 0.002. n = 6 rats.