



Abstract
Transposable elements (TEs) are active in neuronal cells raising the question whether TE insertions contribute to risk of neuropsychiatric disease. While genome‐wide association studies (GWAS) serve as a tool to discover genetic loci associated with neuropsychiatric diseases, unfortunately GWAS do not directly detect structural variants such as TEs. To examine the role of TEs in psychiatric and neurologic disease, we evaluated 17,000 polymorphic TEs and find 76 are in linkage disequilibrium with disease haplotypes (P < 10−6) defined by GWAS. From these 76 polymorphic TEs, we identify potentially causal candidates based on having insertions in genomic regions of regulatory chromatin and on having associations with altered gene expression in brain tissues. We show that lead candidate insertions have regulatory effects on gene expression in human neural stem cells altering the activity of a minimal promoter. Taken together, we identify 10 polymorphic TE insertions that are potential candidates on par with other variants for having a causal role in neurologic and psychiatric disorders.
Keywords: Alu, GWAS, neurologic disease, psychiatric disease, transposable elements
Subject Categories: Chromatin, Transcription & Genomics; Molecular Biology of Disease; Neuroscience
This study reviews 17,000 polymorphic transposable elements and identifies insertions genetically associated with neuropsychiatric disorders. Features of lead examples are on par with other variants for having a causal role in neurologic and psychiatric disorders.

Introduction
Mental disorders affected about 970 million people worldwide in 2017 (Disease et al, 2018). In 2020, 21% of adults in the United States suffered from some form of mental illness (SAMHSA, 2021). Consequently, these diseases cause great social and economic burden. Studies of identical twins show that the heritability of diseases such as attention‐deficit hyperactivity disorder (ADHD), autism spectrum disorder (ASD), bipolar disorder (BIP), and schizophrenia is extremely high ranging from 74 to 81% (Sullivan & Geschwind, 2019). Due to the complexity of the mammalian nervous system, the genetic and cellular etiology of these diseases remains largely unclear (Sullivan & Geschwind, 2019). Progress in genetic methodology has provided the potential to identify mechanisms that underlie these diseases. One approach that has successfully identified important disease loci is the genome‐wide association study (GWAS). Microarrays capable of detecting millions of single‐nucleotide polymorphisms (SNPs) in populations of patients and controls identify loci that are associated with disease traits. However, in the cases of neurologic and major psychiatric disorders such as schizophrenia, GWAS has identified over a hundred genetic loci, most making measurable but small contributions to the risk of disease (International Schizophrenia Consortium et al, 2009; Schizophrenia Working Group of the Psychiatric Genomics Consortium, 2014; Sullivan & Geschwind, 2019). Importantly, there is extensive overlap of the loci that contribute to major psychiatric disorders (Brainstorm et al, 2018; Schork et al, 2019) including some overlap with neurologic disease suggesting there may be benefit in combining the results of GWAS from all psychiatric and neurologic studies when evaluating variants for causality.
Determining causal variants remains the most challenging step in defining the genetic architecture of diseases. The SNPs identified by GWAS to have high disease association (TASs; trait‐associated SNPs) are genetic tags that identify a genomic region that contains a causal mutation(s) leading to disease risk. However, TASs do not always identify the disease‐causing variants (Tam et al, 2019b). The vast majority of TASs (88%) lie in intergenic or intronic regions and therefore do not alter coding sequence (Edwards et al, 2013). For these SNPs to be causal, they would likely have regulatory effects on splicing or transcription. In a comprehensive study across tissues of 147 human subjects, it was noted that structural variants such as rearrangements, copy number variants, and transposable element (TE) insertions comprise a substantial and disproportionately large fraction of the genetic variants that alter gene expression (Chiang et al, 2017). Genome‐wide profiles of SNPs and structural variants were evaluated for loci associated with changes in gene expression from a range of tissues. In mapping these variants, termed expression quantitative trait locus (eQTL), it was found that structural variants were 28–55 times more likely to change gene expression than SNPs (Chiang et al, 2017).
In humans, 25% of structural variants are TEs, the dominant families being Long INterspersed Element‐1 (LINE‐1 or L1), which comprises 17% of the genome and Alu Short Interspersed Elements (SINEs), which are mobilized by L1, and comprise 11% of the genome (Lander et al, 2001). Though the vast majority of human TEs are inactive, the average genome contains 80 to 100 retrotransposition‐active L1 elements (Sassaman et al, 1997; Brouha et al, 2003). These active elements have resulted in more than 124 cases of human disease (Hancks & Kazazian, 2016; Kazazian & Moran, 2017). However, de novo insertions of TEs do not commonly disrupt genes because exons constitute just 1% of the human genome. Instead, TE insertions are much more likely to alter gene expression because TEs carry sequences that can act on enhancers, inhibit RNA pol II transcription, function as splice sites, or terminate transcription (Elbarbary et al, 2016). Given that TEs make up approximately 45% of the human genome, it is not surprising that their regulatory features have often been exapted as building blocks of gene regulatory networks (Faulkner et al, 2009; Chuong et al, 2017).
A number of cellular systems restrict de novo TE insertions by inhibiting the expression of TE mRNA (Goodier & Kazazian, 2008; Coufal et al, 2009; Muotri et al, 2010; Shukla et al, 2013; Castro‐Diaz et al, 2014; de la Rica et al, 2016; Goodier, 2016; Walter et al, 2016; Macia et al, 2017; Liu et al, 2018; Schauer et al, 2018; Cosby et al, 2019; Gu et al, 2021; Seczynska et al, 2022). A notable exception is that tissues of the brain produce significant levels of TE mRNA (Muotri et al, 2005; Coufal et al, 2009; Faulkner et al, 2009; Belancio et al, 2010; Macia et al, 2017; Sanchez‐Luque et al, 2019). Somatic insertions of L1 have been detected in bulk brain tissue (Coufal et al, 2009; Baillie et al, 2011) and in individual neurons (Evrony et al, 2012, 2015; Upton et al, 2015; Erwin et al, 2016; Faulkner & Garcia‐Perez, 2017; Macia et al, 2017; Faulkner & Billon, 2018).
The activity of TEs in neuronal cells coupled with their ability to regulate expression of adjacent genes suggests that insertions in the germline have the potential to contribute to the risk of neurologic and psychiatric disorders. Correlations have been observed between TE expression and some neurologic diseases including Aicardi‐Goutieres syndrome (AGS), multiple sclerosis (MS), amyotrophic lateral sclerosis (ALS), and Alzheimer's disease (AD) (Bodea et al, 2018; Saleh et al, 2019; Tam et al, 2019a). In addition, hallmark proteins of neurodegenerative diseases such as tau for PD and TDP‐43 for ALS may regulate transcription of TEs (Li et al, 2015; Guo et al, 2018). However, the contribution of TE insertions to nervous system diseases has not been broadly studied.
Relatively recent TE insertions can proliferate in the population and become common but not fixed alleles. The 1000 Genomes Project described genetic variation of diverse human populations by sequencing whole genomes of 2,504 individuals (1000 Genomes Project Consortium et al, 2015; Sudmant et al, 2015). This comprehensive survey of genetic variation detected a substantial number of structural variations including 17,000 polymorphic insertions of TEs. These polymorphic TEs represent recent integration events with the potential to alter gene expression. Alu elements make up 75% of the polymorphic inserts while L1 represents 18%. There may be functional consequences of common TE insertion variants that affect common disease risk. Some common polymorphic TEs have been implicated at disease loci detected by GWAS (Payer et al, 2017, 2019, 2021; Wang et al, 2017). Common polymorphic Alu insertions occur disproportionately near disease loci of GWAS, underscoring that Alu insertions are potential causative variants (Payer et al, 2017).
Given the difficulty in identifying genetic variants responsible for neurologic and psychiatric disorders and the regulatory capacity of TEs, we tested whether polymorphic TEs are potential causative variants of these diseases.
Results
In our study, we focused specifically on neurologic and psychiatric disorders and tested polymorphic Alu, L1, ERV (Endogenous Retroviruses), and SVA (SINE‐R, VNTR, and Alu composite) elements reported by the 1000 Genomes Project for association with increased disease risk (Stewart et al, 2011; Sudmant et al, 2015).
Association of TEs with neurologic and psychiatric diseases
To identify polymorphic TEs potentially involved in neurologic and psychiatric diseases, we consolidated the results of 593 GWAS that characterized a wide range of these disorders. From these GWAS, we selected 753 TASs with disease associations of P < 10−6 for further analysis. Lower P‐values were not required because we wished to identify larger numbers of TEs with the potential to associate with disease risk.
We first identified polymorphic TEs associated with each of the TASs based on a maximum distance of 1 megabase (Fig 1A). The TASs mark haplotypes that include other SNPs and structural variants, which act alone or in combination to contribute to disease risk. To determine which of the polymorphic TEs mapping near a TAS are in linkage disequilibrium (LD) with the TAS, we conducted pairwise comparisons between the TE and TAS using 1000 Genome Project genotypes. We found 76 polymorphic TEs were in LD with 101 TASs using the threshold statistics of r 2 > 0.4 and D′ > 0.7 (Dataset EV1). Seventy‐six percent of the TEs associated with TASs were Alu elements (Fig 1B), a frequency equivalent to the proportion of Alu elements among the 17,000 polymorphic TEs. The majority of the Alu insertions belong to AluYa5 or AluYb8 groups, which are the most common forms of polymorphic Alu elements and represent the most recent to transpose (Bennett et al, 2008; Wildschutte et al, 2015; Table EV1).
Figure 1. Polymorphic transposable elements (TEs) in linkage disequilibrium (LD) with trait‐associated SNPs (TASs) of neurologic and psychiatric diseases.
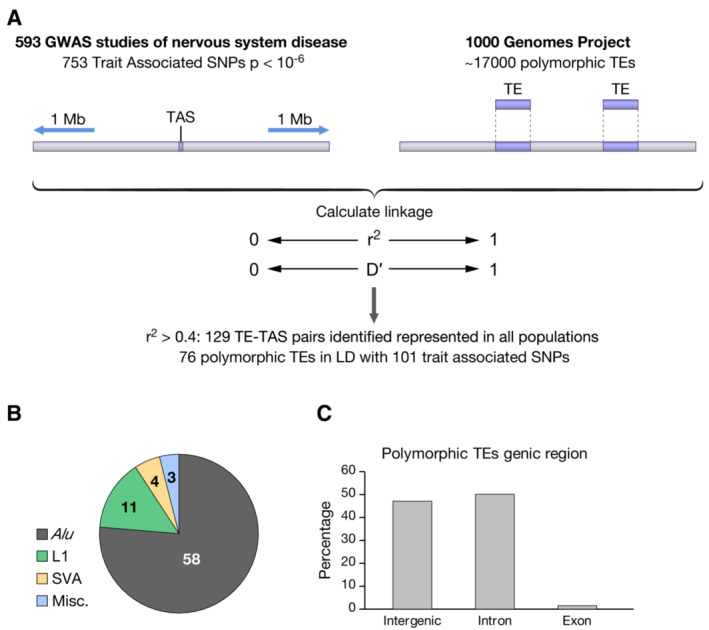
- Polymorphic TEs within 1 Mb of a TAS were evaluated for LD with the TAS.
- Classification of TEs in LD with TASs.
- Genic location of TEs in LD with TASs.
Given the challenges of associating highly repetitive Alu elements to the reference genome using short read sequencing, we directly genotyped Alu insertions by performing PCR on 30 CEU trios (Utah residents with Northern and Western European ancestry), and then identified tagging SNPs using Haploview (Materials and Methods, Table EV2). The LDs between the TE insertions and TASs were measured as r 2 and D′ using Haploview v4.2. With the experimentally validated genotypes, all 10 TEs tested resulted in higher LD values (r 2) with the TASs compared to the calculated linkages using the 1000 Genomes Project genotypes (Table EV2). These results provided confidence that our calculated associations of the 76 TEs with disease loci were accurate and possibly underestimates.
Disease‐associated TEs are located in regulatory elements
The 76 polymorphic TEs in LD with disease TASs were positioned primarily in intergenic sequences or introns (Fig 1C). As a result, the most likely contribution they could have to disease is through imposing changes in gene expression. L1 and Alu elements contain large numbers of transcription factor‐binding sites, which can function to modulate the expression of adjacent promoters (Elbarbary et al, 2016; Sun et al, 2018). In addition, TEs contribute to the expression of many 5′‐capped RNAs by providing transcription start sites (TSS) (Faulkner et al, 2009). As a result, polymorphic TEs positioned in key regulatory sequences would have the potential to alter gene expression. A recent study found polymorphic Alu elements can disrupt regulatory chromatin, introduce regulatory sequence, or in the case of an allele lacking the TE, result in the absence of regulatory sequence (Payer et al, 2021). For these reasons, we examined whether the 76 polymorphic TEs were positioned within, or in the vicinity of, regulatory elements of protein coding genes such as promoters and enhancers.
To identify the presence of regulatory chromatin in the vicinity of the polymorphic TEs, we incorporated a panel of epigenomic data from 111 primary cells and tissues (Roadmap Epigenomics Consortium et al, 2015). The constellation of epigenomic modifications provides genome‐wide signatures of chromatin states as determined with a hidden Markoff model, ChromHMM (Ernst & Kellis, 2012, 2017). These annotated epigenetic marks most likely derive from the preinsertion empty alleles of the polymorphic TEs because the presence of the TE is usually the minor allele and is less common. Also, when the TE is not included in the reference genome standard mapping pipelines would discard the epigenetic reads. We inspected the chromatin states at each of the 76 causal TE candidates with particular attention to neural tissues. Importantly, several of the polymorphic TEs were located in enhancers or promoters active in tissues of the brain, or at sites bound by transcription factors. One example TE is associated with a TAS (rs2303565, r 2 = 0.88 of association with TE) of ALS cases (Fig 2; Ahmeti et al, 2013). This candidate we designated locus number 1 (LN1), is an AluYa4 inserted in the promoter of TTLL4 at a site bound by a large number of transcription factors (Fig 2, Appendix Fig S1A). The promoter highly expresses TTLL4 in the hippocampus, cerebellum, and caudate (FANTOM5 data set; FANTOM Consortium and the RIKEN PMI and CLST (DGT) et al, 2014). TTLL4 catalyzes polyglutamylation of tubulins, a post‐translational modification that regulates the interaction between microtubules and binding proteins (Garnham et al, 2015). Importantly, polyglutamylation modulates microtubule‐related functions of neurite outgrowth and neurodegeneration (Kubo et al, 2010; Rogowski et al, 2010). We considered this insertion of AluYa4 a promising candidate for a causal variant because of its association with increased risk of ALS and its potential to effect gene expression in the brain.
Figure 2. Genetic map and chromatin states of causal transposable element (TE) candidate locus number 1 (LN1).
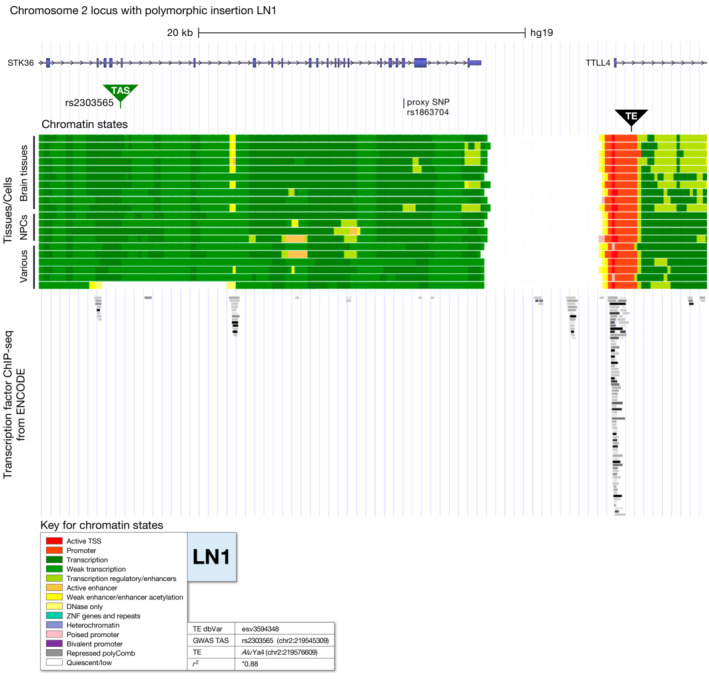
The location of causal candidate LN1 is indicated as is the position of the linked trait‐associated SNP (TAS) rs2303565 associated with amyotrophic lateral sclerosis. The structures of transcripts indicate the exons (blue) and introns (gray with >). The color key indicates the chromatin states as defined by ChromHMM analysis of epigenomic data from the NIH Roadmap Epigenomics Consortium. Chromatin states are shown for brain tissues, neural progenitor cells (NPCs), and a variety of other tissues. See Appendix Fig S1A and Materials and Methods for specific tissues. Next to the color key, NCBI dbVar ID for TE, SNP ID for TAS, genic location of TAS, TE name, and r 2 value are shown. *r 2 value verified by genotyping PCR. ChIP‐seq peaks of transcription factors from ENCODE are shown below ChromHMM chromatin states.
Another polymorphic TE (LN2) notable for its chromatin context was linked to a TAS (rs11759769, r 2 = 0.90 of association with TE) associated with migraine disorder (Fig 3; Anttila et al, 2013). The TE is an Alu positioned at the junction of a 2 kb island of heterochromatin near the 5′ end of FHL5 (Fig 3, Appendix Fig S2A). FHL5 associates with cAMP‐responsive element modulator (CREM), which confers transcriptional activation (GTEx Consortium, 2015; GTEx Consortium et al, 2017). Multiple GWAS has detected associations of FHL5 with increased risk of migraine disorder (Anttila et al, 2013; Gormley et al, 2016; Zhao et al, 2016). Importantly, ChIP‐seq data by the ENCODE consortium detected binding of KAP1 in HEK293 and K562 cells and SETDB1 in U2OS cells at the location of the polymorphic insertion LN2 (ENCODE Project Consortium, 2011; Gerstein et al, 2012; Wang et al, 2012, 2013a; Fig 3). These two factors create heterochromatin that may be perturbed by the Alu insertion (Friedli & Trono, 2015; Trono, 2016).
Figure 3. Genetic map and chromatin states of causal transposable element (TE) candidate LN2.
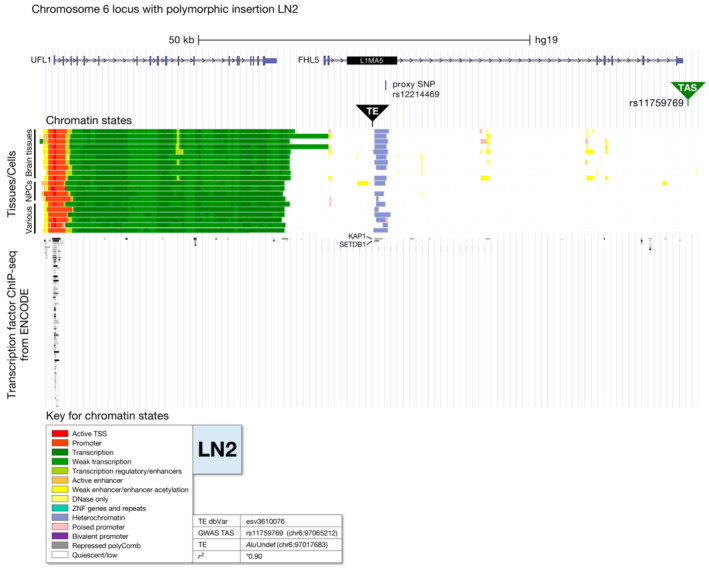
The location of causal candidate LN2 is indicated as is the position of the linked trait‐associated SNP (TAS) rs11759769 associated with migraine disorder. The structures of transcripts indicate the exons (blue) and introns (gray with >). L1MA5 indicates the position of an L1 element fixed in the genome. The color key indicates the chromatin states as defined by ChromHMM analysis of epigenomic data from the NIH Roadmap Epigenomics Consortium. Chromatin states are shown for brain tissues, neural progenitor cells, and a variety of other tissues. See Appendix Fig S2A and Materials and Methods for specific tissues. Next to the color key, NCBI dbVar ID for TE, SNP ID for TAS, genic location of TAS, TE name, and r 2 value are shown. *r 2 value verified by genotyping PCR. ChIP‐seq peaks of transcription factors from ENCODE are shown below ChromHMM chromatin states and peaks for two transcription factors known for heterochromatin formation located around the site of LN2 insertion are labeled.
A third illustration of a TE candidate with the potential to alter expression is an Alu associated with a TAS (rs12185268, r 2 = 1.00 of association with TE) linked to Parkinson's disease (PD) (Do et al, 2011; Fig 4). The Alu, LN16, is inserted at the junction between transcribed and enhancer sequences of KANSL1, which is a subunit of the KAT8 regulatory NSL complex involved with histone acetylation. A GWAS report associates KANSL1 with PD (Witoelar et al, 2017). ChIP‐seq data of ENCODE shows a number of transcription factors bind at the insertion site (Fig 4, Appendix Fig S10A).
Figure 4. Genetic map and chromatin states of causal transposable element (TE) candidate LN16.
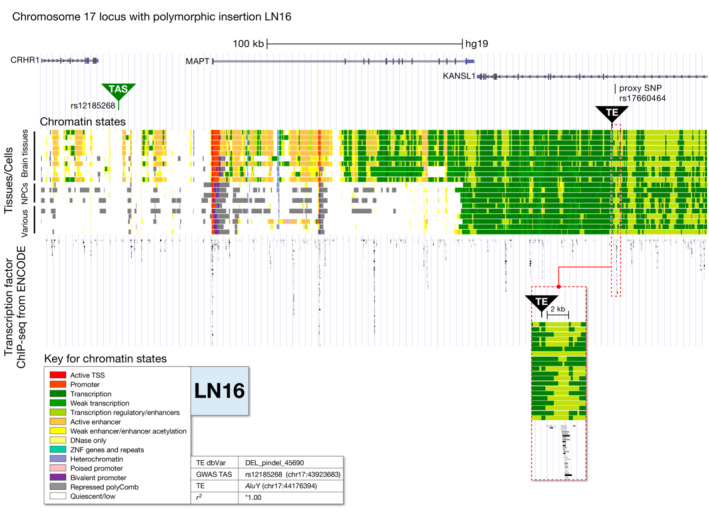
The location of causal candidate LN16 is indicated as is the position of the linked trait‐associated SNP (TAS) rs12185268 associated with Parkinson's disease. The structures of transcripts indicate the exons (blue) and introns (gray with >). The color key indicates the chromatin states as defined by ChromHMM analysis of epigenomic data from the NIH Roadmap Epigenomics Consortium. Chromatin states are shown for brain tissues, neural progenitor cells, and a variety of other tissues. See Appendix Fig S10A and Materials and Methods for specific tissues. Next to the color key, NCBI dbVar ID for TE, SNP ID for TAS, genic location of TAS, TE name, and r 2 value are shown. *r 2 value verified by genotyping PCR. ChIP‐seq peaks of transcription factors from ENCODE are shown below ChromHMM chromatin states. The position of the LN16 TE is enlarged in an inset.
Source data are available online for this figure.
In all, we identified 10 polymorphic TEs to examine further as causal candidates because they were positioned in enhancer, promoter, heterochromatin, or transcribed sequences present in neurologic tissues (Table 1, Appendix Figs S1–S10).
Table 1.
Candidate causal Alu insertions in LD with TASs marking increased risk of psychiatric and neurologic disorders.
| TE locus # (LN) | TE variant (dbVar number) | TE chr | TE coordinate | TE | Genic location | r 2 a | TAS | TAS chr | TAS coordinate | Distance between TE variant and TAS (kb) | Brain eQTL b | Chromatin state in brain c | GWAS disease |
|---|---|---|---|---|---|---|---|---|---|---|---|---|---|
| 1 | esv3594348 | 2 | 219576609 | AluYa4 | Intron | 0.88 | rs2303565 | 2 | 219545309 | 31.3 | Yes | Amyotrophic lateral sclerosis | |
| 2 | esv3610076 | 6 | 97017683 | AluUndef | Intron | 0.90 | rs11759769 | 6 | 97065212 | 47.5 | Yes | Migraine disorder | |
| 3 | esv3636943 | 15 | 76826019 | AluUndef | Intron | 1.00 | rs2957613 | 15 | 76700589 | 125.4 | Yes | Schizophrenia | |
| 4 | DEL_pindel_31897 | 10 | 105097522 | AluYa5 | Intron | 0.74 | rs1712517 | 10 | 105033015 | 64.5 | Yes | Migraine disorder | |
| 5 | DEL_pindel_32884 | 11 | 17195839 | AluYa5 | Intron | 0.92 | rs2008905 | 11 | 17184623 | 11.2 | Yes | Schizophrenia | |
| 7 | DEL_pindel_8035 | 3 | 52709837 | AluYa5 | Intron | 0.96 | rs1042779 | 3 | 52821011 | 111.2 | Yes | ADHD, bipolar, mood, depression disorder | |
| 8 | esv3624791 | 10 | 124736004 | AluYc1 | Intergenic | 0.91 | rs7069346 | 10 | 124729876 | 6.1 | Yes | Migraine disorder | |
| 12 | esv3636634 | 15 | 59169388 | AluUndef | Intergenic | 0.92 | rs793571 | 15 | 59141706 | 27.7 | Yes | Schizophrenia | |
| 15 | DEL_pindel_45694 | 17 | 44223907 | AluYa5 | Intron | 1.00 | rs12185268 | 17 | 43923683 | 300.2 | Yes | Parkinson's disease | |
| 16 | DEL_pindel_45690 | 17 | 44176394 | AluY | Intron | 1.00 | rs12185268 | 17 | 43923683 | 252.7 | Yes | Parkinson's disease |
| Color | Description |
|---|---|
| Promoter | |
| Weak transcription | |
| Transcription regulatory/enhancers | |
| Weak enhancer/enhancer acetylation | |
| Heterochromatin | |
| Quiescent/low |
r 2 validated by genotyping PCR of Alu elements using genomic DNA for a 30‐trio reference panel of CEU HapMap samples from the 1000 Genome Project.
Affected gene/s in immediate vicinity of TE.
Shown is the most impactful chromatin state present in any of 9 brain tissues in a 2 kb region flanking the TE.
Proxy SNPs of polymorphic TEs correlate with altered gene expression in neural tissues
We hypothesized that the polymorphic TEs have a causal relationship with risk of psychiatric and neurologic disorders by altering expression of genes in cis. To this end, our candidate TEs were selected based on their LD to disease loci and mapping to chromatin context with the potential to alter gene expression. For evidence of altered gene expression, we queried the genotype‐tissue expression (GTEx) database containing expression data for 948 donors across 54 tissues (GTEx Consortium, 2015; GTEx Consortium et al, 2017). GTEx readily identifies changes in tissue‐specific gene expression associated with loci specific genetic variation. SNPs in LD are identified as eQTL if the genetic loci with the variants are significantly associated with altered expression of a gene in a specific tissue.
We characterized associations between candidate causal TEs and changes in expression in brain tissues using eQTL analysis. As a proxy for each TE, we selected one SNP present in GTEx genotypes that is most associated (r 2 = 1) and most proximal with a specific TE candidate (hereafter named proxy SNP) (Table 2). All of the proxy SNPs showed significant associations with altered expression of at least one neighboring gene in tissues of the brain (Dataset EV2). All but two of the TE proxy SNPs were eQTLs associated with altered expression in brain tissues of the genes at the insertion sites. Exceptions were the proxy SNPS of intronic insertions LN3 and LN4 which were not eQTLs of the genes in which they reside but were eQTLs in brain tissues of genes in the immediate vicinity (Appendix Figs S3 and S4).
Table 2.
Candidate causal TEs associated with altered expression of genes in brain tissues.
| TE locus # (LN) | Proxy SNP for TE (dbVar number) a | Proxy SNP chr | Proxy SNP hg19 coordinate | Distance between proxy SNP and TE insertion (kb) | r 2 | Genic location of TE insertion | Gene(s) containing or flanking insertion | ||
|---|---|---|---|---|---|---|---|---|---|
| eQTL? | Brain eQTL? b | ||||||||
| 1 | rs1863704 | 2 | 219562675 | 13.9 | 1 | Intronic | TTLL4 | Yes | Yes |
| 2 | rs12214469 | 6 | 97019471 | 1.8 | 1 | Intronic | FHL5 | Yes | Yes |
| 3 | rs157768 | 15 | 76833779 | 7.8 | 1 | Intronic | SCAPER | No | N/A |
| 4 | rs4917387 | 10 | 105108455 | 10.9 | 1 | Intronic | PCGF6 | No | N/A |
| 5 | rs620241 | 11 | 17196890 | 1.1 | 1 | Intronic | PIK3C2A | Yes | Yes |
| 7 | rs10865974 | 3 | 52718280 | 8.4 | 1 | Intronic | PBRM1 | Yes | Yes |
| 8 | rs7902802 | 10 | 124735290 | 0.7 | 1 | Intergenic | C10orf88 and PSTK | Yes (both) | Yes |
| 12 | rs2270664 | 15 | 59181985 | 12.6 | 1 | Intergenic | MINDY2 and SLTM | Yes (both) | Yes |
| 15 | rs2696581 | 17 | 44227186 | 86814.0 | 1 | Intronic | KANSL1 | Yes | Yes |
| 16 | rs17660464 | 17 | 44177993 | 45.9 | 1 | Intronic | KANSL1 | Yes | Yes |
SNP that is most closely linked to the TE insertion site (r 2 = 1).
eQTL showing changes in expression of genes listed (left) (P‐value < 0.05) in at least one brain tissue.
The AluYa4 (Fig 2, LN1) in LD with increased risk of ALS (TAS; rs2303565) is inserted in the promoter of TTLL4 and its proxy SNP is a significant eQTL associated with increased expression of TTLL4 in cerebellar hemisphere and reduced levels in tibial nerve (Appendix Fig S1B). The proxy SNP of LN1 is also associated with altered expression of several neighboring genes near TTLL4 including CNOT9, PLCD4, and ZNF142. The Alu (Fig 3, LN2) in LD with increased risk of migraine disorder (TAS; rs11759769) is tagged with a proxy SNP associated with reduced expression of FHL5 in nucleus accumbens, frontal cortex, substantia nigra, putamen, and anterior cingulate cortex (Appendix Fig S2B and Dataset EV2). The proxy SNP for LN2 is also associated with altered expression of UFL1 which is positioned just 10 kb upstream of the insertion. UFL1 is predicted to have increased expression in cerebellum, cerebellar hemisphere, amygdala, tibial nerve, cortex, caudate, and frontal cortex (Appendix Fig S2A and B, and Dataset EV2). The proxy SNP for the Alu (Fig 4, LN16) linked to increased risk of PD (TAS; rs12185268) is associated with altered expression of several adjacent genes including KANSL1, the gene interrupted by the insertion, as well as ARHGAP27, ARL17A, PLEKHM1, LRRC37A, and MAPT, all genes proximal to the Alu insertion (Appendix Fig S10B and Dataset EV2). These significant changes in expression are predicted in a number of brain tissues including cerebellum, substantia nigra, hypothalamus, caudate, and hippocampus. Additional review of the polymorphic TE candidates using the proxy SNPs identified many more that were significant eQTLs associated with altered expression of genes in brain tissues (Dataset EV2 and Appendix Figs S1B–S10B). To note, we also surveyed the TASs linked to the TE candidates as queries and found most had associations with altered expression of genes that were similar to what we observed when using the proxy SNP as the query (Dataset EV3). These findings support our hypothesis that the candidate causal TEs alter expression of adjacent genes in tissues of the brain.
We relied on these significant associations with altered gene expression and proximity to regulatory chromatin to assemble a list of TE candidates with the greatest potential to be causal in disease mechanisms (Table 1). While one candidate TE (LN8) in Table 1 was inserted in a genomic region that lacked a defined chromatin state (quiescent/low), it was retained in the final list of candidates because LN8 is highly associated with increased risk of migraine disorder and was associated with altered expression of adjacent genes in brain tissues (Appendix Fig S7A and B). The results in Table 1 indicate 10 polymorphic TEs are candidate causal factors in a wide range of neurologic disorders including ALS, migraine disorder, and PD.
Alu insertions alter activity of a minimal promoter in neural stem cells
Having identified a number of polymorphic Alu elements that are significantly associated with disease risk detected by GWAS and that are correlated with altered gene expression in neurologic tissues by eQTL analysis (Table 1, and Datasets EV1 and EV2), we developed a luciferase reporter assay to test whether the insert sequences in the context of flanking sequence can influence transcription activity. For these experiments, we measured the impact of candidate Alu and flanking sequences on the function of a minimal promoter in human neural stem cells, NCRM‐1 (Materials and Methods section).
Candidate Alu inserts with flanking sequences were isolated by PCR from genomic DNA of a 30‐trio reference panel of CEU ancestry provided by the 1000 Genomes Project (Materials and Methods section). Approximately 500 bp flanking the TE insertion sites with and without the Alu elements were inserted into a minimal promoter driving the expression of luciferase within a transiently transfected vector (Fig 5). The flanking sequences with and without the TEs were tested in both orientations relative to the promoter with the forward orientation corresponding to the top strand of the reference genome. Of six candidate Alu insertions evaluated for their impact on promoter activity, we found five significantly altered expression of luciferase (Fig 5). LN1, an AluYa4 associated with ALS, decreased promoter activity to 43% when the TE insertion site was in the forward orientation. LN3, an Alu associated with schizophrenia, resulted in 1.3‐ and 1.2‐fold increases in promoter activity for the forward and reverse orientations of the insertion site, respectively. LN4, an AluYa5 associated with migraine disorder, resulted in 1.6‐ and 1.3‐fold increases in promoter activity for the forward and reverse orientations of the target site, respectively. LN5, an AluYa5 associated with schizophrenia, resulted in 2.5‐ and 1.6‐fold increases in promoter activity for the forward and reverse orientations of the target site, respectively. LN16, an Alu associated with PD resulted in 1.4‐ and 2.1‐fold increases in promoter activity for the forward and reverse orientations of the target site, respectively.
Figure 5. Transcription activity of causal transposable element (TE) candidates.
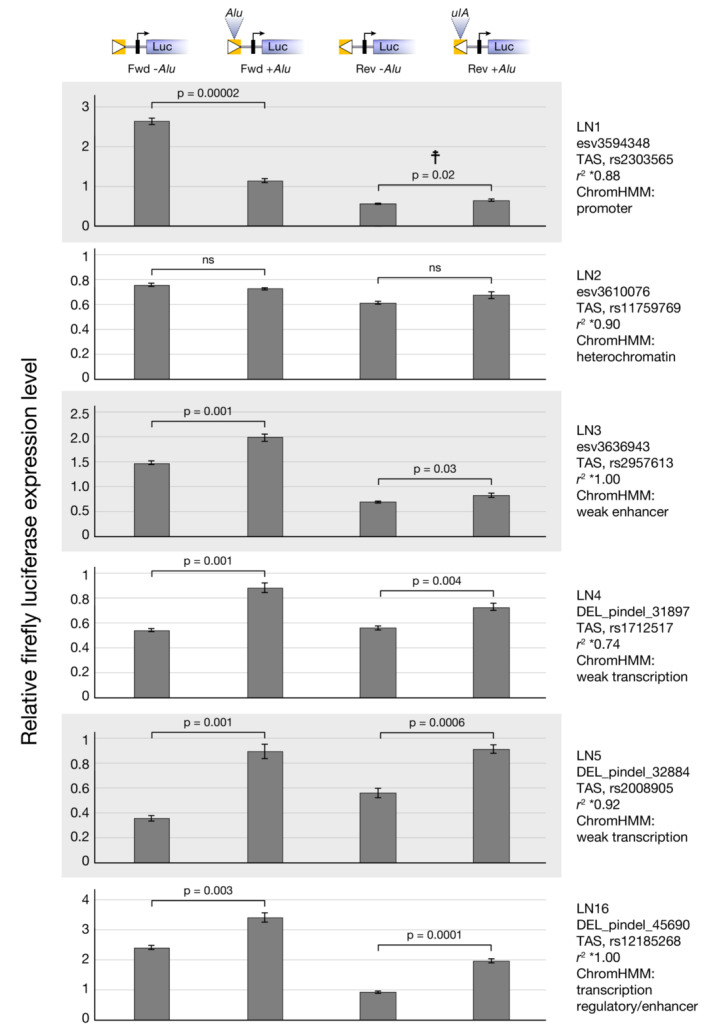
Approximately 500 bp of genomic sequence, with and without Alu inserts was assayed for transcription activity when inserted upstream of a minimal promoter in a luciferase vector transfected into NCRM1 cells. The orientation (white triangle) of the Alu and its associated genomic sequence (yellow box) is diagramed at top. Forward orientation (Fwd) indicates plus strand sequence of the reference genome. The minimal promoter is symbolized by a black rectangle with an arrow indicating the direction of transcription. The causal TE candidates tested, their linked trait‐associated SNPs, and their ChromHMM status are indicated at right. Luciferase values are normalized to transfection efficiency (renilla) for each of four independent transfections and subsequently to luciferase expression from the minimal promoter alone. Mean values (± SD) were determined, and statistical significance was analyzed by Student's two‐sample unequal variance t‐test with a one‐tailed distribution. Each locus was examined in four independent experiments and a representative dataset is shown here. ☨: P < 0.05 in two experiments and P > 0.05 in two experiments. ns: P > 0.05.
Source data are available online for this figure.
Discussion
Approximately 600 GWAS studies have successfully identified haplotypes associated with neurologic and psychiatric diseases. Yet, the causal variants responsible for each risk allele are largely unknown. Large numbers of polymorphic TEs have been identified and these variants have significant potential for regulating gene expression (Sundaram et al, 2014; Chiang et al, 2017; Wang et al, 2017). In a study of interferon response genes in human cells, 27 families of TEs were found to contribute binding sites for STAT1, the activator of interferon‐induced transcription (Chuong et al, 2016). Other analyses of gene networks revealed that regulatory sequence from TEs contribute to the expression of thousands of genes involved in mammalian pregnancy (Lynch et al, 2015). These results raise the important possibility that polymorphic TEs at disease loci may alter expression and be causal alleles. Studies exploring this possibility found polymorphic Alu (Payer et al, 2017) and SVAs (van Bree et al, 2022) were disproportionally enriched at GWAS loci relative to chance. Experiments that tested 110 polymorphic Alu elements for regulatory activity found that the overwhelming majority altered activity of a minimal promoter when tested in the context of 600 bp of flanking sequence (Payer et al, 2021). Examples of Alu insertions that reduced promoter activity were found to disrupt enhancer function as demonstrated when scrambled sequence insertions caused similar reductions in expression. Other Alu insertions were found to possess intrinsic activity that either increased or decreased promoter activity, but these effects can be modified and even reversed by the context of the adjacent sequence (Payer et al, 2021). With this evidence that TEs may contribute to disease risk, we focused on their potential impact on neurologic and psychiatric diseases.
The causal candidate (LN1) is in strong LD (r 2 = 0.88) with a TAS associated with ALS (Fig 2) and has regulatory activity (Fig 5). The insertion is located within a large number of transcription factor‐binding sites in the promoter of TTLL4. LN1 may contribute to disease risk by disrupting promoter function as suggested by the luciferase promoter assay and this model is consistent with the associated reduction in TTLL4 expression in tibial nerve (Fig 6A). Because TTLL4 modulates microtubule‐related functions of neurite outgrowth and is associated with neurodegeneration, reduced expression has the potential to influence ALS (Kubo et al, 2010; Rogowski et al, 2010).
Figure 6. Models for how insertions of candidate causal transposable elements may alter expression of genes.
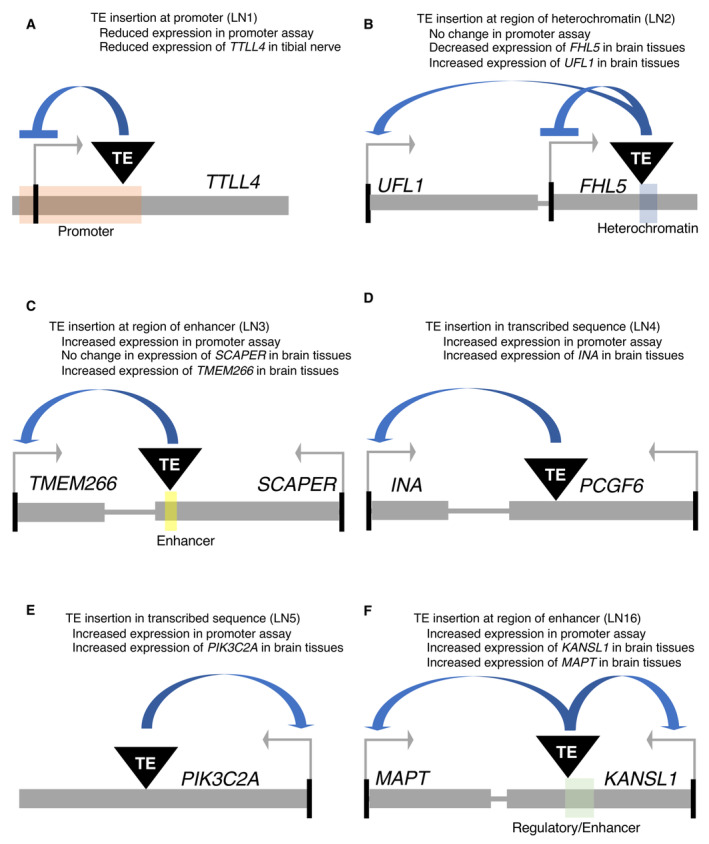
- Locus number 1 (LN1) is located in promoter chromatin of TTLL4 and may disrupt promoter function.
- LN2 is within an island of heterochromatin and may alter chromatin interactions to increase expression of UFL1 and reduce FHL5 expression.
- LN3 is positioned within enhancer chromatin and may increase expression of TMEM266 by contributing activator sequence.
- LN4 is located in transcribed sequence and may increase expression of INA by contributing activator sequence.
- LN5 is located in transcribed sequence and may increase expression of PIK3C2A by contributing activator sequence.
- LN16 is positioned in enhancer chromatin and may increase expression of MAPT and KANSL1 by contributing activator sequence.
The causal candidate LN2 is an Alu insertion in strong LD (r 2 = 0.90) with a TAS associated with migraine disorder (Fig 3). LN2, is inserted in an island of heterochromatin in FHL5 that overlaps a copy of L1MA, a family of L1 fixed in mammalian genomes that is likely recognized by KAP1 and SETDB1 (Giordano et al, 2007). This Alu insertion is associated with decreased expression of FHL5 in a number of brain tissues which we propose is the result of an intrinsic function of this Alu (Fig 6B; Appendix Fig S2A and B). This reduced expression may have a connection with migraine disorder as FHL5 encodes a transcription factor that regulates the cyclic AMP (cAMP)‐responsive factors CREM and CREB (Fimia et al, 2000), which have a role in synaptic plasticity (Dash et al, 1990) and memory formation (Lee & Silva, 2009).
Alternatively, LN2 could promote migraine disorder by its association with increased expression in brain tissues of an adjacent gene UFL1 (Appendix Fig S2A and B) possibly by reducing the influence of the heterochromatin island on UFL1 (Fig 6B). UFL1 encodes an E3‐like ligase for ubiquitin‐fold modifier1 (UFM1), a newly identified ubiquitin like post‐translational modification. Mutations in this pathway can result in microcephaly, cerebellar ataxia, and other neurologic disorders (Colin et al, 2016; Duan et al, 2016; Muona et al, 2016; Qin et al, 2019, 2020).
LN3 is a causal candidate insertion of Alu in strong LD (r 2 = 1.00) with a TAS associated with schizophrenia (Tables 1 and 2). the Alu is inserted within SCAPER in sequence with weak enhancer activity (Appendix Fig S3A). SCAPER regulates cell cycle by interacting with cyclin A/Cdk2 (Tsang et al, 2007) and associated diseases of SCAPER include intellectual disability (Jauregui et al, 2019; Kahrizi et al, 2019; Wormser et al, 2019). The insertion may carry intrinsic activation sequences as indicated by the promoter assay (Figs 5 and 6C). And while LN3 is not associated with increased expression of SCAPER in brain, it is associated with higher levels of a gene located just upstream, TMEM266, which is a voltage sensor expressed primarily in the central nervous system (Dataset EV2; Kim et al, 2014; Papp et al, 2019).
LN4, an AluYA5 insertion in LD (r 2 = 0.74) with a TAS associated with migraine disorder is a causal candidate located within PCGF6 (Appendix Fig S4A), a polycomb group (PcG) protein that represses transcription in embryonic stem cells (Endoh et al, 2017; Zhao et al, 2017). The insertion appears to possess intrinsic activation sequence as indicated in the promoter assay (Fig 5). While LN4 is not associated with altered expression of PCGF6, there is an association in brain tissues with increased expression of the adjacent gene INA, which encodes a component of neurofilaments (Yuan et al, 2006, 2017). As such, an intrinsic activity of LN4 may be responsible for its contribution to disease risk (Fig 6D).
Another causal candidate is an AluYa5 insertion (LN5) in strong LD (r 2 = 0.92) with a TAS associated with schizophrenia. The insertion is located within PIK3C2A, a class II member of the phosphoinositide 3‐kinase (PI3K) family, mutations in which result in impaired primary cilia and disorders of growth, vision, skeletal formation, and neurological development (Appendix Fig S5A) (Falasca & Maffucci, 2012; Franco et al, 2014; Tiosano et al, 2019). The results of the promoter assay indicate that LN5 may possess intrinsic activation sequence (Fig 5). This Alu is associated with increased expression of PIK3C2A in brain tissues, suggesting the potential contribution of LN5 to disease may be to increase expression of PIK3C2A (Fig 6E).
Interestingly, two causal candidate insertions of Alu, LN15, and LN16 are located in KANSL1 and are both in LD (r 2 = 1.0) with the same TAS associated with PD (Fig 4, and Appendix Figs S9A and S10A). These insertions are located in a large block of LD (1.8 Mb) that contains a number of TASs with strong associations with PD and AD (Caffrey & Wade‐Martins, 2007; Pankratz et al, 2009; Simon‐Sanchez et al, 2009; Do et al, 2011; Nalls et al, 2014; Jun et al, 2016; Labbe et al, 2016; Soto‐Beasley et al, 2020). The LN16 Alu may carry intrinsic activation sequence as indicated by the promoter assay (Fig 5). KANSL1 encodes a subunit of histone acetyltransferase (HAT) complexes that is widely expressed and modifies chromatin accessibility (Cai et al, 2010; Huang et al, 2012). While the potential contribution of LN16 to disease may be due to its association with increased expression of KANSL1, it is also associated with increased expression of the adjacent gene MAPT, which encodes tau protein, the predominant component of neurofibrillary tangles that are the primary indication of AD. GWAS of multiple cohorts identified variants linked to MAPT that contribute to risk of PD (Pankratz et al, 2009; Simon‐Sanchez et al, 2009; Edwards et al, 2010; Do et al, 2011; International Parkinson Disease Genomics et al, 2011; Nalls et al, 2014). These findings raise the prospect that LN16 has the potential to increase risk of PD through increasing expression of MAPT (Fig 6F).
By identifying polymorphic TEs that are linked to risk of neurologic and psychiatric diseases, we have provided a valuable list of causal candidates that are structural variants positioned in regulatory chromatin and represent eQTLs linked to altered expression of proximal genes in brain tissue. One hypothesis worth pursuing is that due to their propensity to be expressed in brain tissue, TEs as polymorphic variants can be causal candidates of neurologic and psychiatric diseases because they can readily influence expression of adjacent genes. Additionally, polymorphisms within polymorphic TEs can alter the activity of TEs adding additional layers of diversity to the role of polymorphic TEs in gene expression (Seleme et al, 2006). Alteration of gene expression caused by candidate causal TE insertions may lead to direct changes in neuronal cell physiology, causing disease pathologies. However, there are also sufficient numbers of Alu elements associated with increased risk of non‐neurologic diseases to argue polymorphic TEs should be studied more broadly for contribution to diseases (Payer et al, 2017, 2021).
The identification of polymorphic TEs that contribute to disease risk is currently limited by the available methods used to genotype the insertions. Unlike the detection of SNPs in patient populations, determining the precise position and phasing of TEs in large numbers of genomes remains a significant challenge. One advance on the horizon is the increasing availability of genomes assembled with ultra‐long read and strand‐specific DNA sequencing (Chaisson et al, 2019; Ebert et al, 2021). These methods have greatly improved the sensitivity, accuracy, and phasing of structural variants. Unfortunately, these methods are not yet scalable to the extent where they can be directly applied to patient populations. One significant opportunity that is provided by the new long read methods is their haplotype‐resolved pangenome assemblies can be leveraged by new algorithms to improve genotyping of structural variants detected in short read sequence data (Ebler et al, 2022). In addition, the structural variants sequenced and assigned to haplotypes from long read assemblies can now be genotyped from short read sequencing (Ebert et al, 2021; Siren et al, 2021). But because short read sequencing has become widely available and cost effective, significant advances in genotyping novel TEs may come from newly developed tools that directly analyze short read sequences (preprint: Kojima et al, 2022).
Materials and Methods
Mapping transposable elements to GWAS signals
We collected SNPs from the GWAS catalog (Welter et al, 2014) that were identified to be associated with nervous system diseases and mental illness, with a genome‐wide association P‐value lower than 10−6 (NHGRI catalog, accessed April 2017). The final set included 753 SNPs. Simultaneously, we collected the database of ~17,000 polymorphic retrotransposons mapped to the human genome (hg19) by the 1000 Genomes Project Phase 3 (downloaded from ftp://ftp.1000genomes.ebi.ac.uk/vol1/ftp/release/20130502/ and ftp://ftp.1000genomes.ebi.ac.uk/vol1/ftp/release/20130502/supporting/SVs_missing_from_main_release/). TEs missing from the main release were merged into the main vcf files from Phase 3 using vcftools (Danecek et al, 2011) and plink (www.cog‐genomics.org/plink/1.9/; Purcell et al, 2007; Chang et al, 2015).
Linkage disequilibrium between TE and TAS
To determine the level of association between the retrotransposon and the TAS, we calculated LD using the r 2 and D′ statistics by using the genomes of 2,504 individuals available from the 1000 Genomes Project. We calculated the LD for TEs up to 1 Mb surrounding the TAS. We used the vcftools and plink software to filter data from the 1000 Genomes Project to only include the GWAS hits and retrotransposons and calculate these statistics (Purcell et al, 2007; Danecek et al, 2011; Chang et al, 2015). Using the same methodology, we calculated the LD values for all 5 super populations independently (Europeans, Africans, South Asians, East Asians, and Americans). We visualized their linkage association by using Haploview 4.2 (Barrett et al, 2005) and retained only the ones with a LD of r 2 > 0.4 and D′ > 0.7. Given most GWAS are done in European populations, only the European Superpopulation was considered when selecting TEs associated with TAS.
Modeling candidate genes and retrotransposons impact in function
To determine the impact of the TEs associated with a TAS, we downloaded the chromatin states inputted by ChromHMM from the Roadmap epigenomics project (Melé et al, 2015). ChromHMM uses a Hidden Markov Model that integrates multiple chromatin data sets of various histone modifications (H3K4me1, H3K4me2, H3K4me3, H3K9ac, H3K27ac, H4K20me1, H3K79me2, H3K36me3, H3K9me3, H3K27me3, H2A.Z, and DNase) to discover de novo major reoccurring combinatorial and spatial patterns of histone marks. The resulting model can then be used to systematically annotate a genome in one or more cell types with potential regulatory regions. The chromatin states in Figs 2, 3, 4 and the Appendix Figs S1–S10 were derived in the following order from these tissues: Brain Anterior Caudate, Brain Cingulate Gyrus, Brain Hippocampus, Brain Inferior Temporal Lobe, Brain Substantia Nigra, Brain Germinal Matrix, Brain Angular Gyrus, Fetal Brain Male, Fetal Brain Female, Brain Dorsolateral Prefrontal Cortex, H1 Cells, H1 Derived Mesenchymal Stem Cells, H9 Derived Neuron Cultured Cells, Mesenchymal Stem Cell Derived Chondrocyte Cultured Cells, Right Atrium, Bone Marrow‐Derived Cultured Mesenchymal Stem Cells, Thymus, Liver, Lung, Primary mononuclear cells from peripheral blood. The estimated chromatin states for all TEs were obtained from overlapping the coordinates from the RoadMap Epigenomics chromatin data with the TEs that showed r 2 > 0.4 with a GWAS hit in any population. The coordinates were obtained from https://egg2.wustl.edu/roadmap/web_portal/chr_state_learning.html#exp_18state/all.expanded.browserFiles.tgz (used imputed data).
To estimate the impact of the TE in gene expression, we annotated all potential expression quantitative trait loci (eQTL) associated with the GWAS hit using the genotype‐tissue expression (GTEx) Project database, last accessed in August 23, 2018. As a proxy for the impact of the TE in gene expression, we annotated eQTLs associated with the best proxy SNP for the TE and linked TAS using the GTEx project database (v8). The data used for the analyses described in this manuscript were obtained from the GTEx Portal in November 2020. Normalized effect size (NES) is defined as the slope of the linear regression and is computed as the effect of the alternative allele (ALT) relative to the reference allele (REF) in the human genome reference (i.e., the eQTL effect allele is the ALT allele). NES is computed in a normalized space where magnitude has no direct biological interpretation.
PCR validation of population frequency and LD
For a representative set of 10 TEs of interest, we validated correct sequence and insert points as well as experimentally validated the genotype across HapMap reference samples to confirm TE frequency and LD with the TAS using genotyping PCR as previously described (Payer et al, 2017). Briefly, genomic DNA for a 30‐trio (mother–father–child) reference panel of Centre d'Etude du Polymorphisme Humain (CEPH) Utah Residents with Northern and Western European Ancestry (CEU) was obtained in a 96‐well plate format (HAPMAPPT01) (Corriell, NJ, USA). PCR was performed with genotyping primers flanking reported insertion sites and amplicons were resolved by gel electrophoresis. PCR conditions and primers can be found in Appendix Table S1. PCRs were designed to show both the preinsertion (empty) allele and the insertion (filled) allele. Haploview was used to determine relationships between the Alu insertions and adjacent HapMap SNPs on the same chromosome. Genotypes of SNPs within the TAS LD block were obtained from the release #28 of HapMap data (http://hapmap.ncbi.nlm.nih.gov/). LD between the TE insertion and TAS was measured as r 2 and D′ using Haploview v4.2 (Barrett et al, 2005). Allele frequency for each Alu‐containing allele was obtained using data from PCR genotyping validation.
Neural stem cell (NSC) culture
Neural stem cells NCRM1 (derived from cord blood, NIH) were thawed and cultured as previously described, NCRM‐1 (RRID:CVCL_1E71) (Wang et al, 2013b). Briefly, we coated six‐well tissue culture plates using hESC‐qualified Matrigel (Corning Life Sciences, Tewksbury, MA, USA) for 30 min at room temperature. Cells were thawed from liquid nitrogen in a 37°C bath, spun at 1,000 rpm for 5 min, and plated at approximate concentration of 1 × 10⁵ cells/ml with StemPro™ NSC SFM medium (Gibco, ThermoFisher Scientific, USA). Cells were incubated for 2–3 days and passaged near confluence (80%). Passaging of the cells consisted of washing cells with D‐PBS, adding appropriate volume of accutase (ThermoFisher Scientific, USA) depending on plate surface area and incubating at 37°C. Dissociated cells were collected and spun down at 1,000 rpm for 5 min. Supernatant was removed carefully, and 10 ml of NSC medium was added. Cells were counted using Cellometer Auto 2000 cell counter (Nexcelom Biosciences, Lawrence, MA, USA) and plated onto a Matrigel‐coated 6‐well plate at 20,000–30,000 cells per cm2. For luciferase reporter assay, NCRM‐1 cells were seeded at ~1.0 × 10⁵ cells/well on Matrigel‐coated 24‐well plates. The cells reached 90% confluence after 24 h, ready for the transfection experiments. NCRM1 cells were tested for contamination with mycoplasma. Cells were not authenticated via STR or other genetic methods because they were derived from cord blood and no previous genetic analyses were conducted that could be used for a comparison.
Luciferase reporter assays
We transfected NSCs with luciferase plasmids containing the selected retrotransposons. To do this, we amplified approximately 500 bp surrounding the insertion and inserted the PCR product into Topo‐TA cloning instructions (Invitrogen, ThermoFisher Scientific, USA). We generated two clones, one with the TE insertion and one without. These clones were Sanger sequenced confirming no SNPs between insert and empty alleles. Using the enzymes EcoRV, HindIII, XhoI, and SacI, we cloned the fragments into the Firefly luciferase vector pGL4.26 (Cat# E8441, Promega, WI, USA). Details regarding TE, surrounding sequences, and enzymes used can be found in Appendix Table S2. Each vector was cotransfected into NSC with Renilla luciferase control reporter vector pRL‐SV40 (Cat# E2231, Promega, WI, USA) using Lipofectamine 2000 transfection reagent (Invitrogen, ThermoFisher Scientific, USA). After 48 h, cells were lysed to collect protein which was transferred to a 96‐well plate to perform a luciferase assay using the Dual‐Glo Luciferase Assay System (Cat# E1910, Promega, WI, USA), which detects the activities of Firefly luciferase (luc) and Renilla luciferase (hRuc) reporters, where the latter is used as baseline control of expression and transfection. We compared the luciferase expression levels of the construct with the insertion to the one without, and normalized expression values using hRluc, and the luc empty vector. Each assay had four replicates per clone. Each TE insertion was tested at least four independent times.
Author contributions
Hyo Won Ahn: Data curation; formal analysis; investigation; visualization; methodology; writing – original draft; project administration; writing – review and editing. Zelia F Worman: Conceptualization; data curation; software; formal analysis; supervision; investigation; writing – original draft. Arianna Lechsinska: Investigation; methodology. Lindsay M Payer: Data curation; formal analysis; investigation; methodology. Tongguang Wang: Methodology. Nasir Malik: Methodology. Wenxue Li: Methodology. Kathleen H Burns: Conceptualization; investigation; methodology. Avindra Nath: Methodology. Henry L Levin: Conceptualization; resources; formal analysis; supervision; investigation; methodology; writing – original draft; project administration; writing – review and editing.
Disclosure and competing interests statement
The authors declare that they have no conflict of interest.
Supporting information
Appendix
Table EV1
Table EV2
Dataset EV1
Dataset EV2
Dataset EV3
Source Data for Appendix
Source Data for Figure 4
Source Data for Figure 5
Acknowledgements
This research was supported by the Intramural Research Program of the NIH from the Eunice Kennedy Shriver National Institute of Child Health and Human Development. Additional funds were provided by the Eunice Kennedy Shriver National Institute of Child Health and Human Development Division of Intramural Research Director's Award. This study utilized the high‐performance computational capabilities of the Biowulf Linux cluster at the National Institutes of Health, Bethesda, MD, USA (http://biowulf.nih.gov). The Genotype‐Tissue Expression (GTEx) Project was supported by the Common Fund of the Office of the Director of the National Institutes of Health (commonfund.nih.gov/GTEx). Additional funds were provided by the National Cancer Institute of the National Institutes of Health, USA, NHGRI, NHLBI, National Institute on Drug Abuse (NIDA) of the National Institutes of Health, USA, NIMH, and NINDS. Donors were enrolled at Biospecimen Source Sites funded by NCI\Leidos Biomedical Research, Inc. subcontracts to the National Disease Research Interchange (10XS170), Roswell Park Cancer Institute (10XS171), and Science Care, Inc. (X10S172). The Laboratory, Data Analysis, and Coordinating Center (LDACC) was funded through a contract (HHSN268201000029C) to the The Broad Institute, Inc. Biorepository operations were funded through a Leidos Biomedical Research, Inc. subcontract to Van Andel Research Institute (10ST1035). Additional data repository and project management were provided by Leidos Biomedical Research, Inc. (HHSN261200800001E). The Brain Bank was supported supplements to University of Miami grant DA006227. Statistical Methods development grants were made to the University of Geneva (MH090941 & MH101814), the University of Chicago (MH090951, MH090937, MH101825, and MH101820), the Umbrella Institution University of North Carolina, Chapel Hill (MH090936), North Carolina State University (MH101819), Harvard University (MH090948), Stanford University (MH101782), Washington University in St. Louis (MH101810), and to the University of Pennsylvania (MH101822). The data sets used for the analyses described in this manuscript were obtained from dbGaP at http://www.ncbi.nlm.nih.gov/gap through dbGaP accession number phs000424.GTEx.v6.p1.c1.GRU. The synopsis graphic was created with BioRender.com.
EMBO Reports (2023) 24: e55197.
Data availability
This study includes no data deposited in external repositories.
References
- 1000 Genomes Project Consortium , Auton A, Brooks LD, Durbin RM, Garrison EP, Kang HM, Korbel JO, Marchini JL, McCarthy S, McVean GA et al (2015) A global reference for human genetic variation. Nature 526: 68–74 [DOI] [PMC free article] [PubMed] [Google Scholar]
- Ahmeti KB, Ajroud‐Driss S, Al‐Chalabi A, Andersen PM, Armstrong J, Birve A, Blauw HM, Brown RH, Bruijn L, Chen W et al (2013) Age of onset of amyotrophic lateral sclerosis is modulated by a locus on 1p34.1. Neurobiol Aging 34: 357 [DOI] [PMC free article] [PubMed] [Google Scholar]
- Anttila V, Winsvold BS, Gormley P, Kurth T, Bettella F, McMahon G, Kallela M, Malik R, de Vries B, Terwindt G et al (2013) Genome‐wide meta‐analysis identifies new susceptibility loci for migraine. Nat Genet 45: 912–917 [DOI] [PMC free article] [PubMed] [Google Scholar]
- Baillie JK, Barnett MW, Upton KR, Gerhardt DJ, Richmond TA, De Sapio F, Brennan PM, Rizzu P, Smith S, Fell M et al (2011) Somatic retrotransposition alters the genetic landscape of the human brain. Nature 479: 534–537 [DOI] [PMC free article] [PubMed] [Google Scholar]
- Barrett JC, Fry B, Maller J, Daly MJ (2005) Haploview: analysis and visualization of LD and haplotype maps. Bioinformatics 21: 263–265 [DOI] [PubMed] [Google Scholar]
- Belancio VP, Roy‐Engel AM, Pochampally RR, Deininger P (2010) Somatic expression of LINE‐1 elements in human tissues. Nucleic Acids Res 38: 3909–3922 [DOI] [PMC free article] [PubMed] [Google Scholar]
- Bennett EA, Keller H, Mills RE, Schmidt S, Moran JV, Weichenrieder O, Devine SE (2008) Active Alu retrotransposons in the human genome. Genome Res 18: 1875–1883 [DOI] [PMC free article] [PubMed] [Google Scholar]
- Bodea GO, McKelvey EGZ, Faulkner GJ (2018) Retrotransposon‐induced mosaicism in the neural genome. Open Biol 8: 180074 [DOI] [PMC free article] [PubMed] [Google Scholar]
- Brainstorm C, Anttila V, Bulik‐Sullivan B, Finucane HK, Walters RK, Bras J, Duncan L, Escott‐Price V, Falcone GJ, Gormley P et al (2018) Analysis of shared heritability in common disorders of the brain. Science 360: eaap8757 [DOI] [PMC free article] [PubMed] [Google Scholar]
- Brouha B, Schustak J, Badge RM, Lutz‐Prigge S, Farley AH, Moran JV, Kazazian HH Jr (2003) Hot L1s account for the bulk of retrotransposition in the human population. Proc Natl Acad Sci USA 100: 5280–5285 [DOI] [PMC free article] [PubMed] [Google Scholar]
- Caffrey TM, Wade‐Martins R (2007) Functional MAPT haplotypes: bridging the gap between genotype and neuropathology. Neurobiol Dis 27: 1–10 [DOI] [PMC free article] [PubMed] [Google Scholar]
- Cai Y, Jin J, Swanson SK, Cole MD, Choi SH, Florens L, Washburn MP, Conaway JW, Conaway RC (2010) Subunit composition and substrate specificity of a MOF‐containing histone acetyltransferase distinct from the male‐specific lethal (MSL) complex. J Biol Chem 285: 4268–4272 [DOI] [PMC free article] [PubMed] [Google Scholar]
- Castro‐Diaz N, Ecco G, Coluccio A, Kapopoulou A, Yazdanpanah B, Friedli M, Duc J, Jang SM, Turelli P, Trono D (2014) Evolutionally dynamic L1 regulation in embryonic stem cells. Genes Dev 28: 1397–1409 [DOI] [PMC free article] [PubMed] [Google Scholar]
- Chaisson MJP, Sanders AD, Zhao X, Malhotra A, Porubsky D, Rausch T, Gardner EJ, Rodriguez OL, Guo L, Collins RL et al (2019) Multi‐platform discovery of haplotype‐resolved structural variation in human genomes. Nat Commun 10: 1784 [DOI] [PMC free article] [PubMed] [Google Scholar]
- Chang CC, Chow CC, Tellier LC, Vattikuti S, Purcell SM, Lee JJ (2015) Second‐generation PLINK: rising to the challenge of larger and richer datasets. Gigascience 4: 7 [DOI] [PMC free article] [PubMed] [Google Scholar]
- Chiang C, Scott AJ, Davis JR, Tsang EK, Li X, Kim Y, Hadzic T, Damani FN, Ganel L, GTEx Consortium et al (2017) The impact of structural variation on human gene expression. Nat Genet 49: 692–699 [DOI] [PMC free article] [PubMed] [Google Scholar]
- Chuong EB, Elde NC, Cédric F (2016) Regulatory evolution of innate immunity through co‐option of endogenous retroviruses. Science 351: 6 [DOI] [PMC free article] [PubMed] [Google Scholar]
- Chuong EB, Elde NC, Feschotte C (2017) Regulatory activities of transposable elements: from conflicts to benefits. Nat Rev Genet 18: 71–86 [DOI] [PMC free article] [PubMed] [Google Scholar]
- Colin E, Daniel J, Ziegler A, Wakim J, Scrivo A, Haack TB, Khiati S, Denomme AS, Amati‐Bonneau P, Charif M et al (2016) Biallelic variants in UBA5 reveal that disruption of the UFM1 cascade can result in early‐onset encephalopathy. Am J Hum Genet 99: 695–703 [DOI] [PMC free article] [PubMed] [Google Scholar]
- Cosby RL, Chang NC, Feschotte C (2019) Host‐transposon interactions: conflict, cooperation, and cooption. Genes Dev 33: 1098–1116 [DOI] [PMC free article] [PubMed] [Google Scholar]
- Coufal NG, Garcia‐Perez JL, Peng GE, Yeo GW, Mu Y, Lovci MT, Morell M, O'shea KS, Moran JV, Gage FH (2009) L1 retrotransposition in human neural progenitor cells. Nature 460: 1127–1131 [DOI] [PMC free article] [PubMed] [Google Scholar]
- Danecek P, Auton A, Abecasis G, Albers CA, Banks E, DePristo MA, Handsaker RE, Lunter G, Marth GT, Sherry ST et al (2011) The variant call format and VCFtools. Bioinformatics 27: 2156–2158 [DOI] [PMC free article] [PubMed] [Google Scholar]
- Dash PK, Hochner B, Kandel ER (1990) Injection of the cAMP‐responsive element into the nucleus of Aplysia sensory neurons blocks long‐term facilitation. Nature 345: 718–721 [DOI] [PubMed] [Google Scholar]
- de la Rica L, Deniz O, Cheng KC, Todd CD, Cruz C, Houseley J, Branco MR (2016) TET‐dependent regulation of retrotransposable elements in mouse embryonic stem cells. Genome Biol 17: 234 [DOI] [PMC free article] [PubMed] [Google Scholar]
- Disease GBD, Injury I, Prevalence C (2018) Global, regional, and national incidence, prevalence, and years lived with disability for 354 diseases and injuries for 195 countries and territories, 1990‐2017: a systematic analysis for the Global Burden of Disease Study 2017. Lancet 392: 1789–1858 [DOI] [PMC free article] [PubMed] [Google Scholar]
- Do CB, Tung JY, Dorfman E, Kiefer AK, Drabant EM, Francke U, Mountain JL, Goldman SM, Tanner CM, Langston JW et al (2011) Web‐based genome‐wide association study identifies two novel loci and a substantial genetic component for Parkinson's disease. PLoS Genet 7: e1002141 [DOI] [PMC free article] [PubMed] [Google Scholar]
- Duan R, Shi Y, Yu L, Zhang G, Li J, Lin Y, Guo J, Wang J, Shen L, Jiang H et al (2016) UBA5 mutations cause a new form of autosomal recessive cerebellar ataxia. PLoS One 11: e0149039 [DOI] [PMC free article] [PubMed] [Google Scholar]
- Ebert P, Audano PA, Zhu Q, Rodriguez‐Martin B, Porubsky D, Bonder MJ, Sulovari A, Ebler J, Zhou W, Serra Mari R et al (2021) Haplotype‐resolved diverse human genomes and integrated analysis of structural variation. Science 372: eabf7117 [DOI] [PMC free article] [PubMed] [Google Scholar]
- Ebler J, Ebert P, Clarke WE, Rausch T, Audano PA, Houwaart T, Mao Y, Korbel JO, Eichler EE, Zody MC et al (2022) Pangenome‐based genome inference allows efficient and accurate genotyping across a wide spectrum of variant classes. Nat Genet 54: 518–525 [DOI] [PMC free article] [PubMed] [Google Scholar]
- Edwards TL, Scott WK, Almonte C, Burt A, Powell EH, Beecham GW, Wang L, Zuchner S, Konidari I, Wang G et al (2010) Genome‐wide association study confirms SNPs in SNCA and the MAPT region as common risk factors for Parkinson disease. Ann Hum Genet 74: 97–109 [DOI] [PMC free article] [PubMed] [Google Scholar]
- Edwards SL, Beesley J, French JD, Dunning AM (2013) Beyond GWASs: illuminating the dark road from association to function. Am J Hum Genet 93: 779–797 [DOI] [PMC free article] [PubMed] [Google Scholar]
- Elbarbary RA, Lucas BA, Maquat LE (2016) Retrotransposons as regulators of gene expression. Science 351: aac7247 [DOI] [PMC free article] [PubMed] [Google Scholar]
- ENCODE Project Consortium (2011) A user's guide to the encyclopedia of DNA elements (ENCODE). PLoS Biol 9: e1001046 [DOI] [PMC free article] [PubMed] [Google Scholar]
- Endoh M, Endo TA, Shinga J, Hayashi K, Farcas A, Ma KW, Ito S, Sharif J, Endoh T, Onaga N et al (2017) PCGF6‐PRC1 suppresses premature differentiation of mouse embryonic stem cells by regulating germ cell‐related genes. Elife 6: e21064 [DOI] [PMC free article] [PubMed] [Google Scholar]
- Ernst J, Kellis M (2012) ChromHMM: automating chromatin‐state discovery and characterization. Nat Methods 9: 215–216 [DOI] [PMC free article] [PubMed] [Google Scholar]
- Ernst J, Kellis M (2017) Chromatin‐state discovery and genome annotation with ChromHMM. Nat Protoc 12: 2478–2492 [DOI] [PMC free article] [PubMed] [Google Scholar]
- Erwin JA, Paquola AC, Singer T, Gallina I, Novotny M, Quayle C, Bedrosian TA, Alves FI, Butcher CR, Herdy JR et al (2016) L1‐associated genomic regions are deleted in somatic cells of the healthy human brain. Nat Neurosci 19: 1583–1591 [DOI] [PMC free article] [PubMed] [Google Scholar]
- Evrony GD, Cai X, Lee E, Hills LB, Elhosary PC, Lehmann HS, Parker JJ, Atabay KD, Gilmore EC, Poduri A et al (2012) Single‐neuron sequencing analysis of L1 retrotransposition and somatic mutation in the human brain. Cell 151: 483–496 [DOI] [PMC free article] [PubMed] [Google Scholar]
- Evrony GD, Lee E, Mehta BK, Benjamini Y, Johnson RM, Cai X, Yang L, Haseley P, Lehmann HS, Park PJ et al (2015) Cell lineage analysis in human brain using endogenous retroelements. Neuron 85: 49–59 [DOI] [PMC free article] [PubMed] [Google Scholar]
- Falasca M, Maffucci T (2012) Regulation and cellular functions of class II phosphoinositide 3‐kinases. Biochem J 443: 587–601 [DOI] [PubMed] [Google Scholar]
- FANTOM Consortium and the RIKEN PMI and CLST (DGT) , Forrest AR, Kawaji H, Rehli M, Baillie JK, de Hoon MJ, Haberle V, Lassmann T, Kulakovskiy IV, Lizio M et al (2014) A promoter‐level mammalian expression atlas. Nature 507: 462–470 [DOI] [PMC free article] [PubMed] [Google Scholar]
- Faulkner GJ, Billon V (2018) L1 retrotransposition in the soma: a field jumping ahead. Mob DNA 9: 22 [DOI] [PMC free article] [PubMed] [Google Scholar]
- Faulkner GJ, Garcia‐Perez JL (2017) L1 mosaicism in mammals: extent, effects, and evolution. Trends Genet 33: 802–816 [DOI] [PubMed] [Google Scholar]
- Faulkner GJ, Kimura Y, Daub CO, Wani S, Plessy C, Irvine KM, Schroder K, Cloonan N, Steptoe AL, Lassmann T et al (2009) The regulated retrotransposon transcriptome of mammalian cells. Nat Genet 41: 563–571 [DOI] [PubMed] [Google Scholar]
- Fimia GM, De Cesare D, Sassone‐Corsi P (2000) A family of LIM‐only transcriptional coactivators: tissue‐specific expression and selective activation of CREB and CREM. Mol Cell Biol 20: 8613–8622 [DOI] [PMC free article] [PubMed] [Google Scholar]
- Franco I, Gulluni F, Campa CC, Costa C, Margaria JP, Ciraolo E, Martini M, Monteyne D, De Luca E, Germena G et al (2014) PI3K class II alpha controls spatially restricted endosomal PtdIns3P and Rab11 activation to promote primary cilium function. Dev Cell 28: 647–658 [DOI] [PMC free article] [PubMed] [Google Scholar]
- Friedli M, Trono D (2015) The developmental control of transposable elements and the evolution of higher species. Annu Rev Cell Dev Biol 31: 429–451 [DOI] [PubMed] [Google Scholar]
- Garnham CP, Vemu A, Wilson‐Kubalek EM, Yu I, Szyk A, Lander GC, Milligan RA, Roll‐Mecak A (2015) Multivalent microtubule recognition by tubulin tyrosine ligase‐like family Glutamylases. Cell 161: 1112–1123 [DOI] [PMC free article] [PubMed] [Google Scholar]
- Gerstein MB, Kundaje A, Hariharan M, Landt SG, Yan KK, Cheng C, Mu XJ, Khurana E, Rozowsky J, Alexander R et al (2012) Architecture of the human regulatory network derived from ENCODE data. Nature 489: 91–100 [DOI] [PMC free article] [PubMed] [Google Scholar]
- Giordano J, Ge Y, Gelfand Y, Abrusan G, Benson G, Warburton PE (2007) Evolutionary history of mammalian transposons determined by genome‐wide defragmentation. PLoS Comput Biol 3: e137 [DOI] [PMC free article] [PubMed] [Google Scholar]
- Goodier JL (2016) Restricting retrotransposons: a review. Mob DNA 7: 16 [DOI] [PMC free article] [PubMed] [Google Scholar]
- Goodier JL, Kazazian HH (2008) Retrotransposons revisited: the restraint and rehabilitation of parasites. Cell 135: 23–35 [DOI] [PubMed] [Google Scholar]
- Gormley P, Anttila V, Winsvold BS, Palta P, Esko T, Pers TH, Farh KH, Cuenca‐Leon E, Muona M, Furlotte NA et al (2016) Meta‐analysis of 375,000 individuals identifies 38 susceptibility loci for migraine. Nat Genet 48: 856–866 [DOI] [PMC free article] [PubMed] [Google Scholar]
- GTEx Consortium (2015) Human genomics. The genotype‐tissue expression (GTEx) pilot analysis: multitissue gene regulation in humans. Science 348: 648–660 [DOI] [PMC free article] [PubMed] [Google Scholar]
- GTEx Consortium , Laboratory, Data Analysis &Coordinating Center (LDACC)—Analysis Working Group , Statistical Methods groups—Analysis Working Group , Enhancing GTEx (eGTEx) Groups , NIH Common Fund , NIH/NCI , NIH/NHGRI , NIH/NIMH , NIH/NIDA , Biospecimen Collection Source Site—NDRI et al (2017) Genetic effects on gene expression across human tissues. Nature 550: 204–213 [DOI] [PMC free article] [PubMed] [Google Scholar]
- Gu Z, Liu Y, Zhang Y, Cao H, Lyu J, Wang X, Wylie A, Newkirk SJ, Jones AE, Lee M Jr et al (2021) Silencing of LINE‐1 retrotransposons is a selective dependency of myeloid leukemia. Nat Genet 53: 672–682 [DOI] [PMC free article] [PubMed] [Google Scholar]
- Guo C, Jeong HH, Hsieh YC, Klein HU, Bennett DA, De Jager PL, Liu Z, Shulman JM (2018) Tau activates transposable elements in Alzheimer's disease. Cell Rep 23: 2874–2880 [DOI] [PMC free article] [PubMed] [Google Scholar]
- Hancks DC, Kazazian HH Jr (2016) Roles for retrotransposon insertions in human disease. Mob DNA 7: 9 [DOI] [PMC free article] [PubMed] [Google Scholar]
- Huang J, Wan B, Wu L, Yang Y, Dou Y, Lei M (2012) Structural insight into the regulation of MOF in the male‐specific lethal complex and the non‐specific lethal complex. Cell Res 22: 1078–1081 [DOI] [PMC free article] [PubMed] [Google Scholar]
- International Parkinson Disease Genomics Consortium , Nalls MA, Plagnol V, Hernandez DG, Sharma M, Sheerin UM, Saad M, Simon‐Sanchez J, Schulte C, Lesage S et al (2011) Imputation of sequence variants for identification of genetic risks for Parkinson's disease: a meta‐analysis of genome‐wide association studies. Lancet 377: 641–649 [DOI] [PMC free article] [PubMed] [Google Scholar]
- International Schizophrenia Consortium , Purcell SM, Wray NR, Stone JL, Visscher PM, O'Donovan MC, Sullivan PF, Sklar P (2009) Common polygenic variation contributes to risk of schizophrenia and bipolar disorder. Nature 460: 748–752 [DOI] [PMC free article] [PubMed] [Google Scholar]
- Jauregui R, Thomas AL, Liechty B, Velez G, Mahajan VB, Clark L, Tsang SH (2019) SCAPER‐associated nonsyndromic autosomal recessive retinitis pigmentosa. Am J Med Genet A 179: 312–316 [DOI] [PMC free article] [PubMed] [Google Scholar]
- Jun G, Ibrahim‐Verbaas CA, Vronskaya M, Lambert JC, Chung J, Naj AC, Kunkle BW, Wang LS, Bis JC, Bellenguez C et al (2016) A novel Alzheimer disease locus located near the gene encoding tau protein. Mol Psychiatry 21: 108–117 [DOI] [PMC free article] [PubMed] [Google Scholar]
- Kahrizi K, Huber M, Galetzka D, Dewi S, Schroder J, Weis E, Kariminejad A, Fattahi Z, Ropers HH, Schweiger S et al (2019) Homozygous variants in the gene SCAPER cause syndromic intellectual disability. Am J Med Genet A 179: 1214–1225 [DOI] [PubMed] [Google Scholar]
- Kazazian HH Jr, Moran JV (2017) Mobile DNA in health and disease. N Engl J Med 377: 361–370 [DOI] [PMC free article] [PubMed] [Google Scholar]
- Kim IH, Hevezi P, Varga C, Pathak MM, Hong L, Ta D, Tran CT, Zlotnik A, Soltesz I, Tombola F (2014) Evidence for functional diversity between the voltage‐gated proton channel Hv1 and its closest related protein HVRP1. PLoS One 9: e105926 [DOI] [PMC free article] [PubMed] [Google Scholar]
- Kojima S, Koyama S, Ka M, Saito Y, Parrish EH, Endo M, Takata S, Mizukoshi M, Hikino K, Takeda A et al (2022) Mobile elements in human population‐specific genome and phenotype divergence. bioRxiv 10.1101/2022.03.25.485726 [PREPRINT] [DOI]
- Kubo T, Yanagisawa HA, Yagi T, Hirono M, Kamiya R (2010) Tubulin polyglutamylation regulates axonemal motility by modulating activities of inner‐arm dyneins. Curr Biol 20: 441–445 [DOI] [PubMed] [Google Scholar]
- Labbe C, Heckman MG, Lorenzo‐Betancor O, Soto‐Ortolaza AI, Walton RL, Murray ME, Allen M, Uitti RJ, Wszolek ZK, Smith GE et al (2016) MAPT haplotype H1G is associated with increased risk of dementia with Lewy bodies. Alzheimers Dement 12: 1297–1304 [DOI] [PMC free article] [PubMed] [Google Scholar]
- Lander ES, Linton LM, Birren B, Nusbaum C, Zody MC, Baldwin J, Devon K, Dewar K, Doyle M, FitzHugh W et al (2001) Initial sequencing and analysis of the human genome. Nature 409: 860–921 [DOI] [PubMed] [Google Scholar]
- Lee YS, Silva AJ (2009) The molecular and cellular biology of enhanced cognition. Nat Rev Neurosci 10: 126–140 [DOI] [PMC free article] [PubMed] [Google Scholar]
- Li W, Lee M‐H, Henderson L, Tyagi R, Bachani M, Steiner J, Campanac E, Hoffman DA, von Geldern G, Johnson K et al (2015) Human endogenous retrovirus‐K contributes to motor neuron disease. Sci Transl Med 7: 307ra153 [DOI] [PMC free article] [PubMed] [Google Scholar]
- Liu N, Lee CH, Swigut T, Grow E, Gu B, Bassik MC, Wysocka J (2018) Selective silencing of euchromatic L1s revealed by genome‐wide screens for L1 regulators. Nature 553: 228–232 [DOI] [PMC free article] [PubMed] [Google Scholar]
- Lynch VJ, Nnamani MC, Kapusta A, Brayer K, Plaza SL, Mazur EC, Emera D, Sheikh SZ, Grutzner F, Bauersachs S et al (2015) Ancient transposable elements transformed the uterine regulatory landscape and transcriptome during the evolution of mammalian pregnancy. Cell Rep 10: 551–561 [DOI] [PMC free article] [PubMed] [Google Scholar]
- Macia A, Widmann TJ, Heras SR, Ayllon V, Sanchez L, Benkaddour‐Boumzaouad M, Munoz‐Lopez M, Rubio A, Amador‐Cubero S, Blanco‐Jimenez E et al (2017) Engineered LINE‐1 retrotransposition in nondividing human neurons. Genome Res 27: 335–348 [DOI] [PMC free article] [PubMed] [Google Scholar]
- Melé M, Ferreira PG, Reverter F, DeLuca DS, Monlong J, Sammeth M, Young TR, Goldmann JM, Pervouchine DD, Sullivan TJ et al (2015) The human transcriptome across tissues and individuals. Science 348: 660–665 [DOI] [PMC free article] [PubMed] [Google Scholar]
- Muona M, Ishimura R, Laari A, Ichimura Y, Linnankivi T, Keski‐Filppula R, Herva R, Rantala H, Paetau A, Poyhonen M et al (2016) Biallelic variants in UBA5 link dysfunctional UFM1 ubiquitin‐like modifier pathway to severe infantile‐onset encephalopathy. Am J Hum Genet 99: 683–694 [DOI] [PMC free article] [PubMed] [Google Scholar]
- Muotri AR, Chu VT, Marchetto MC, Deng W, Moran JV, Gage FH (2005) Somatic mosaicism in neuronal precursor cells mediated by L1 retrotransposition. Nature 435: 903–910 [DOI] [PubMed] [Google Scholar]
- Muotri AR, Marchetto MC, Coufal NG, Oefner R, Yeo G, Nakashima K, Gage FH (2010) L1 retrotransposition in neurons is modulated by MeCP2. Nature 468: 443–446 [DOI] [PMC free article] [PubMed] [Google Scholar]
- Nalls MA, Pankratz N, Lill CM, Do CB, Hernandez DG, Saad M, DeStefano AL, Kara E, Bras J, Sharma M et al (2014) Large‐scale meta‐analysis of genome‐wide association data identifies six new risk loci for Parkinson's disease. Nat Genet 46: 989–993 [DOI] [PMC free article] [PubMed] [Google Scholar]
- Pankratz N, Wilk JB, Latourelle JC, DeStefano AL, Halter C, Pugh EW, Doheny KF, Gusella JF, Nichols WC, Foroud T et al (2009) Genomewide association study for susceptibility genes contributing to familial Parkinson disease. Hum Genet 124: 593–605 [DOI] [PMC free article] [PubMed] [Google Scholar]
- Papp F, Lomash S, Szilagyi O, Babikow E, Smith J, Chang TH, Bahamonde MI, Toombes GES, Swartz KJ (2019) TMEM266 is a functional voltage sensor regulated by extracellular Zn2 . Elife 8: e42372 [DOI] [PMC free article] [PubMed] [Google Scholar]
- Payer LM, Steranka JP, Yang WR, Kryatova M, Medabalimi S, Ardeljan D, Liu C, Boeke JD, Avramopoulos D, Burns KH (2017) Structural variants caused by Alu insertions are associated with risks for many human diseases. Proc Natl Acad Sci USA 114: E3984–E3992 [DOI] [PMC free article] [PubMed] [Google Scholar]
- Payer LM, Steranka JP, Ardeljan D, Walker J, Fitzgerald KC, Calabresi PA, Cooper TA, Burns KH (2019) Alu insertion variants alter mRNA splicing. Nucleic Acids Res 47: 421–431 [DOI] [PMC free article] [PubMed] [Google Scholar]
- Payer LM, Steranka JP, Kryatova MS, Grillo G, Lupien M, Rocha PP, Burns KH (2021) Alu insertion variants alter gene transcript levels. Genome Res 31: 2236–2248 [DOI] [PMC free article] [PubMed] [Google Scholar]
- Purcell S, Neale B, Todd‐Brown K, Thomas L, Ferreira MA, Bender D, Maller J, Sklar P, de Bakker PI, Daly MJ et al (2007) PLINK: a tool set for whole‐genome association and population‐based linkage analyses. Am J Hum Genet 81: 559–575 [DOI] [PMC free article] [PubMed] [Google Scholar]
- Qin B, Yu J, Nowsheen S, Wang M, Tu X, Liu T, Li H, Wang L, Lou Z (2019) UFL1 promotes histone H4 ufmylation and ATM activation. Nat Commun 10: 1242 [DOI] [PMC free article] [PubMed] [Google Scholar]
- Qin B, Yu J, Nowsheen S, Zhao F, Wang L, Lou Z (2020) STK38 promotes ATM activation by acting as a reader of histone H4 ufmylation. Sci Adv 6: eaax8214 [DOI] [PMC free article] [PubMed] [Google Scholar]
- Roadmap Epigenomics Consortium , Kundaje A, Meuleman W, Ernst J, Bilenky M, Yen A, Heravi‐Moussavi A, Kheradpour P, Zhang Z, Wang J et al (2015) Integrative analysis of 111 reference human epigenomes. Nature 518: 317–330 [DOI] [PMC free article] [PubMed] [Google Scholar]
- Rogowski K, van Dijk J, Magiera MM, Bosc C, Deloulme JC, Bosson A, Peris L, Gold ND, Lacroix B, Bosch Grau M et al (2010) A family of protein‐deglutamylating enzymes associated with neurodegeneration. Cell 143: 564–578 [DOI] [PubMed] [Google Scholar]
- Saleh A, Macia A, Muotri AR (2019) Transposable elements, inflammation, and neurological disease. Front Neurol 10: 894 [DOI] [PMC free article] [PubMed] [Google Scholar]
- SAMHSA (2021) Key substance use and mental health indicators in the United States: results from the 2020 National Survey on Drug Use and Health, NSDUH Series H‐56. Center for Behavioral Health Statistics and Quality, Substance Abuse and Mental Health Services Administration
- Sanchez‐Luque FJ, Kempen MHC, Gerdes P, Vargas‐Landin DB, Richardson SR, Troskie RL, Jesuadian JS, Cheetham SW, Carreira PE, Salvador‐Palomeque C et al (2019) LINE‐1 evasion of epigenetic repression in humans. Mol Cell 75: 590–604 [DOI] [PubMed] [Google Scholar]
- Sassaman DM, Dombroski BA, Moran JV, Kimberland ML, Naas TP, DeBerardinis RJ, Gabriel A, Swergold GD, Kazazian HH Jr (1997) Many human L1 elements are capable of retrotransposition. Nat Genet 16: 37–43 [DOI] [PubMed] [Google Scholar]
- Schauer SN, Carreira PE, Shukla R, Gerhardt DJ, Gerdes P, Sanchez‐Luque FJ, Nicoli P, Kindlova M, Ghisletti S, Santos AD et al (2018) L1 retrotransposition is a common feature of mammalian hepatocarcinogenesis. Genome Res 28: 639–653 [DOI] [PMC free article] [PubMed] [Google Scholar]
- Schizophrenia Working Group of the Psychiatric Genomics Consortium (2014) Biological insights from 108 schizophrenia‐associated genetic loci. Nature 511: 421–427 [DOI] [PMC free article] [PubMed] [Google Scholar]
- Schork AJ, Won H, Appadurai V, Nudel R, Gandal M, Delaneau O, Revsbech Christiansen M, Hougaard DM, Baekved‐Hansen M, Bybjerg‐Grauholm J et al (2019) A genome‐wide association study of shared risk across psychiatric disorders implicates gene regulation during fetal neurodevelopment. Nat Neurosci 22: 353–361 [DOI] [PMC free article] [PubMed] [Google Scholar]
- Seczynska M, Bloor S, Cuesta SM, Lehner PJ (2022) Genome surveillance by HUSH‐mediated silencing of intronless mobile elements. Nature 601: 440–445 [DOI] [PMC free article] [PubMed] [Google Scholar]
- Seleme MC, Vetter MR, Cordaux R, Bastone L, Batzer MA, Kazazian HH Jr (2006) Extensive individual variation in L1 retrotransposition capability contributes to human genetic diversity. Proc Natl Acad Sci USA 103: 6611–6616 [DOI] [PMC free article] [PubMed] [Google Scholar]
- Shukla R, Upton Kyle R, Muñoz‐Lopez M, Gerhardt Daniel J, Fisher Malcolm E, Nguyen T, Brennan Paul M, Baillie JK, Collino A, Ghisletti S et al (2013) Endogenous retrotransposition activates oncogenic pathways in hepatocellular carcinoma. Cell 153: 101–111 [DOI] [PMC free article] [PubMed] [Google Scholar]
- Simon‐Sanchez J, Schulte C, Bras JM, Sharma M, Gibbs JR, Berg D, Paisan‐Ruiz C, Lichtner P, Scholz SW, Hernandez DG et al (2009) Genome‐wide association study reveals genetic risk underlying Parkinson's disease. Nat Genet 41: 1308–1312 [DOI] [PMC free article] [PubMed] [Google Scholar]
- Siren J, Monlong J, Chang X, Novak AM, Eizenga JM, Markello C, Sibbesen JA, Hickey G, Chang PC, Carroll A et al (2021) Pangenomics enables genotyping of known structural variants in 5202 diverse genomes. Science 374: abg8871 [DOI] [PMC free article] [PubMed] [Google Scholar]
- Soto‐Beasley AI, Walton RL, Valentino RR, Hook PW, Labbe C, Heckman MG, Johnson PW, Goff LA, Uitti RJ, McLean PJ et al (2020) Screening non‐MAPT genes of the Chr17q21 H1 haplotype in Parkinson's disease. Parkinsonism Relat Disord 78: 138–144 [DOI] [PMC free article] [PubMed] [Google Scholar]
- Stewart C, Kural D, Stromberg MP, Walker JA, Konkel MK, Stutz AM, Urban AE, Grubert F, Lam HY, Lee WP et al (2011) A comprehensive map of mobile element insertion polymorphisms in humans. PLoS Genet 7: e1002236 [DOI] [PMC free article] [PubMed] [Google Scholar]
- Sudmant PH, Rausch T, Gardner EJ, Handsaker RE, Abyzov A, Huddleston J, Zhang Y, Ye K, Jun G, Hsi‐Yang Fritz M et al (2015) An integrated map of structural variation in 2,504 human genomes. Nature 526: 75–81 [DOI] [PMC free article] [PubMed] [Google Scholar]
- Sullivan PF, Geschwind DH (2019) Defining the genetic, genomic, cellular, and diagnostic architectures of psychiatric disorders. Cell 177: 162–183 [DOI] [PMC free article] [PubMed] [Google Scholar]
- Sun X, Wang X, Tang Z, Grivainis M, Kahler D, Yun C, Mita P, Fenyo D, Boeke JD (2018) Transcription factor profiling reveals molecular choreography and key regulators of human retrotransposon expression. Proc Natl Acad Sci USA 115: E5526–E5535 [DOI] [PMC free article] [PubMed] [Google Scholar]
- Sundaram V, Cheng Y, Ma Z, Li D, Xing X, Edge P, Snyder MP, Wang T (2014) Widespread contribution of transposable elements to the innovation of gene regulatory networks. Genome Res 24: 1963–1976 [DOI] [PMC free article] [PubMed] [Google Scholar]
- Tam OH, Ostrow LW, Gale Hammell M (2019a) Diseases of the nERVous system: retrotransposon activity in neurodegenerative disease. Mob DNA 10: 32 [DOI] [PMC free article] [PubMed] [Google Scholar]
- Tam V, Patel N, Turcotte M, Bosse Y, Pare G, Meyre D (2019b) Benefits and limitations of genome‐wide association studies. Nat Rev Genet 20: 467–484 [DOI] [PubMed] [Google Scholar]
- Tiosano D, Baris HN, Chen A, Hitzert MM, Schueler M, Gulluni F, Wiesener A, Bergua A, Mory A, Copeland B et al (2019) Mutations in PIK3C2A cause syndromic short stature, skeletal abnormalities, and cataracts associated with ciliary dysfunction. PLoS Genet 15: e1008088 [DOI] [PMC free article] [PubMed] [Google Scholar]
- Trono D (2016) Transposable elements, polydactyl proteins, and the genesis of human‐specific transcription networks. Cold Spring Harb Symp Quant Biol 80: 281–288 [DOI] [PMC free article] [PubMed] [Google Scholar]
- Tsang WY, Wang L, Chen Z, Sanchez I, Dynlacht BD (2007) SCAPER, a novel cyclin A‐interacting protein that regulates cell cycle progression. J Cell Biol 178: 621–633 [DOI] [PMC free article] [PubMed] [Google Scholar]
- Upton KR, Gerhardt DJ, Jesuadian JS, Richardson SR, Sanchez‐Luque FJ, Bodea GO, Ewing AD, Salvador‐Palomeque C, van der Knaap MS, Brennan PM et al (2015) Ubiquitous L1 mosaicism in hippocampal neurons. Cell 161: 228–239 [DOI] [PMC free article] [PubMed] [Google Scholar]
- van Bree EJ, Guimaraes R, Lundberg M, Blujdea ER, Rosenkrantz JL, White FTG, Poppinga J, Ferrer‐Raventos P, Schneider AE, Clayton I et al (2022) A hidden layer of structural variation in transposable elements reveals potential genetic modifiers in human disease‐risk loci. Genome Res 32: 656–670 [DOI] [PMC free article] [PubMed] [Google Scholar]
- Walter M, Teissandier A, Perez‐Palacios R, Bourc'his D (2016) An epigenetic switch ensures transposon repression upon dynamic loss of DNA methylation in embryonic stem cells. Elife 5: e11418 [DOI] [PMC free article] [PubMed] [Google Scholar]
- Wang J, Zhuang J, Iyer S, Lin X, Whitfield TW, Greven MC, Pierce BG, Dong X, Kundaje A, Cheng Y et al (2012) Sequence features and chromatin structure around the genomic regions bound by 119 human transcription factors. Genome Res 22: 1798–1812 [DOI] [PMC free article] [PubMed] [Google Scholar]
- Wang J, Zhuang J, Iyer S, Lin XY, Greven MC, Kim BH, Moore J, Pierce BG, Dong X, Virgil D et al (2013a) Factorbook.org: a Wiki‐based database for transcription factor‐binding data generated by the ENCODE consortium. Nucleic Acids Res 41: D171–D176 [DOI] [PMC free article] [PubMed] [Google Scholar]
- Wang T, Choi E, Monaco MC, Campanac E, Medynets M, Do T, Rao P, Johnson KR, Elkahloun AG, Von Geldern G et al (2013b) Derivation of neural stem cells from human adult peripheral CD34+ cells for an autologous model of neuroinflammation. PLoS One 8: e81720 [DOI] [PMC free article] [PubMed] [Google Scholar]
- Wang L, Norris ET, Jordan IK (2017) Human retrotransposon insertion polymorphisms are associated with health and disease via gene regulatory phenotypes. Front Microbiol 8: 1418 [DOI] [PMC free article] [PubMed] [Google Scholar]
- Welter D, MacArthur J, Morales J, Burdett T, Hall P, Junkins H, Klemm A, Flicek P, Manolio T, Hindorff L et al (2014) The NHGRI GWAS Catalog, a curated resource of SNP‐trait associations. Nucleic Acids Res 42: D1001–D1006 [DOI] [PMC free article] [PubMed] [Google Scholar]
- Wildschutte JH, Baron A, Diroff NM, Kidd JM (2015) Discovery and characterization of Alu repeat sequences via precise local read assembly. Nucleic Acids Res 43: 10292–10307 [DOI] [PMC free article] [PubMed] [Google Scholar]
- Witoelar A, Jansen IE, Wang Y, Desikan RS, Gibbs JR, Blauwendraat C, Thompson WK, Hernandez DG, Djurovic S, Schork AJ et al (2017) Genome‐wide pleiotropy between Parkinson disease and autoimmune diseases. JAMA Neurol 74: 780–792 [DOI] [PMC free article] [PubMed] [Google Scholar]
- Wormser O, Gradstein L, Yogev Y, Perez Y, Kadir R, Goliand I, Sadka Y, El Riati S, Flusser H, Nachmias D et al (2019) SCAPER localizes to primary cilia and its mutation affects cilia length, causing Bardet‐Biedl syndrome. Eur J Hum Genet 27: 928–940 [DOI] [PMC free article] [PubMed] [Google Scholar]
- Yuan A, Rao MV, Sasaki T, Chen Y, Kumar A, Veeranna, Liem RK, Eyer J, Peterson AC, Julien JP et al (2006) Alpha‐internexin is structurally and functionally associated with the neurofilament triplet proteins in the mature CNS. J Neurosci 26: 10006–10019 [DOI] [PMC free article] [PubMed] [Google Scholar]
- Yuan A, Rao MV, Veeranna NRA (2017) Neurofilaments and neurofilament proteins in health and disease. Cold Spring Harb Perspect Biol 9: a018309 [DOI] [PMC free article] [PubMed] [Google Scholar]
- Zhao H, Eising E, de Vries B, Vijfhuizen LS, International Headache Genetics Consortium , Anttila V, Winsvold BS, Kurth T, Stefansson H, Kallela M et al (2016) Gene‐based pleiotropy across migraine with aura and migraine without aura patient groups. Cephalalgia 36: 648–657 [DOI] [PMC free article] [PubMed] [Google Scholar]
- Zhao W, Tong H, Huang Y, Yan Y, Teng H, Xia Y, Jiang Q, Qin J (2017) Essential role for polycomb group protein Pcgf6 in embryonic stem cell maintenance and a noncanonical polycomb repressive complex 1 (PRC1) integrity. J Biol Chem 292: 2773–2784 [DOI] [PMC free article] [PubMed] [Google Scholar]