


Figure 4. Latent state correlations between spines at dual connections.
(a) Scatter plot of spine volumes (black, lexicographic ordering) for dual connections. Data points are mirrored across the diagonal (gray). The joint distribution is fit by a mixture model (orange) like that of Figure 3f, but with latent states correlated as in (e). (b) Projecting the points onto the vertical axis yields a histogram of spine volumes for dual connections (Figure 3d). Model is derived from the joint distribution. (c) Projecting onto the x=y diagonal yields a histogram of the geometric mean of spine volumes (Figure 3e). Model is derived from the joint distribution. (d) Projecting onto the x=−y diagonal yields a histogram of the ratio of spine volumes. (e) The latent states of synapses in a dual connection (H1 and H2) are more likely to be the same (SS or LL) than different (SL/LS), as shown by the joint probability distribution. (f) When conditioned on the latent states, the spine volumes (V1 and V2) are statistically independent, as shown in this dependency diagram of the model. (g), (h) Sampling synapse pairs to SS and LL states according to their state probabilities. The top shows a kernel density estimation of multiple iterations of sampling. The bottom shows the distribution of Pearson’s r correlations across many sampling rounds (N=10,000). Error bars are of the model fit.

Figure 4—figure supplement 1. Fits versus raw distributions.

Figure 4—figure supplement 2. Latent state correlations between clefts at dual connections.

Figure 4—figure supplement 3. Residuals spine head volume after subtracting binary components.
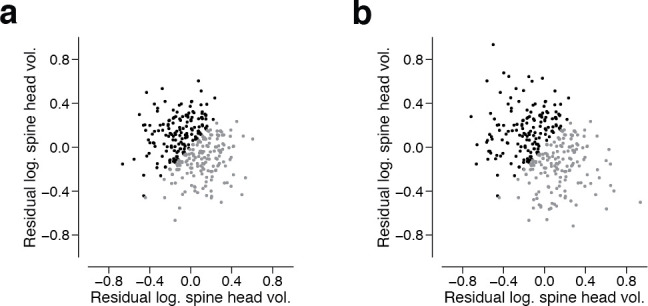
Figure 4—figure supplement 4. Synapses in a dual connection: near versus far pairs.

Figure 4—figure supplement 5. Dual connection correlations are not a result of axon or dendrite biases.

Figure 4—figure supplement 6. Removing constraints on the synaptic population eliminates bimodality and reduces correlations.
