


Fig. 7 |. Silencing MAT2a alters the transcriptome and H3K36me3 deposition.
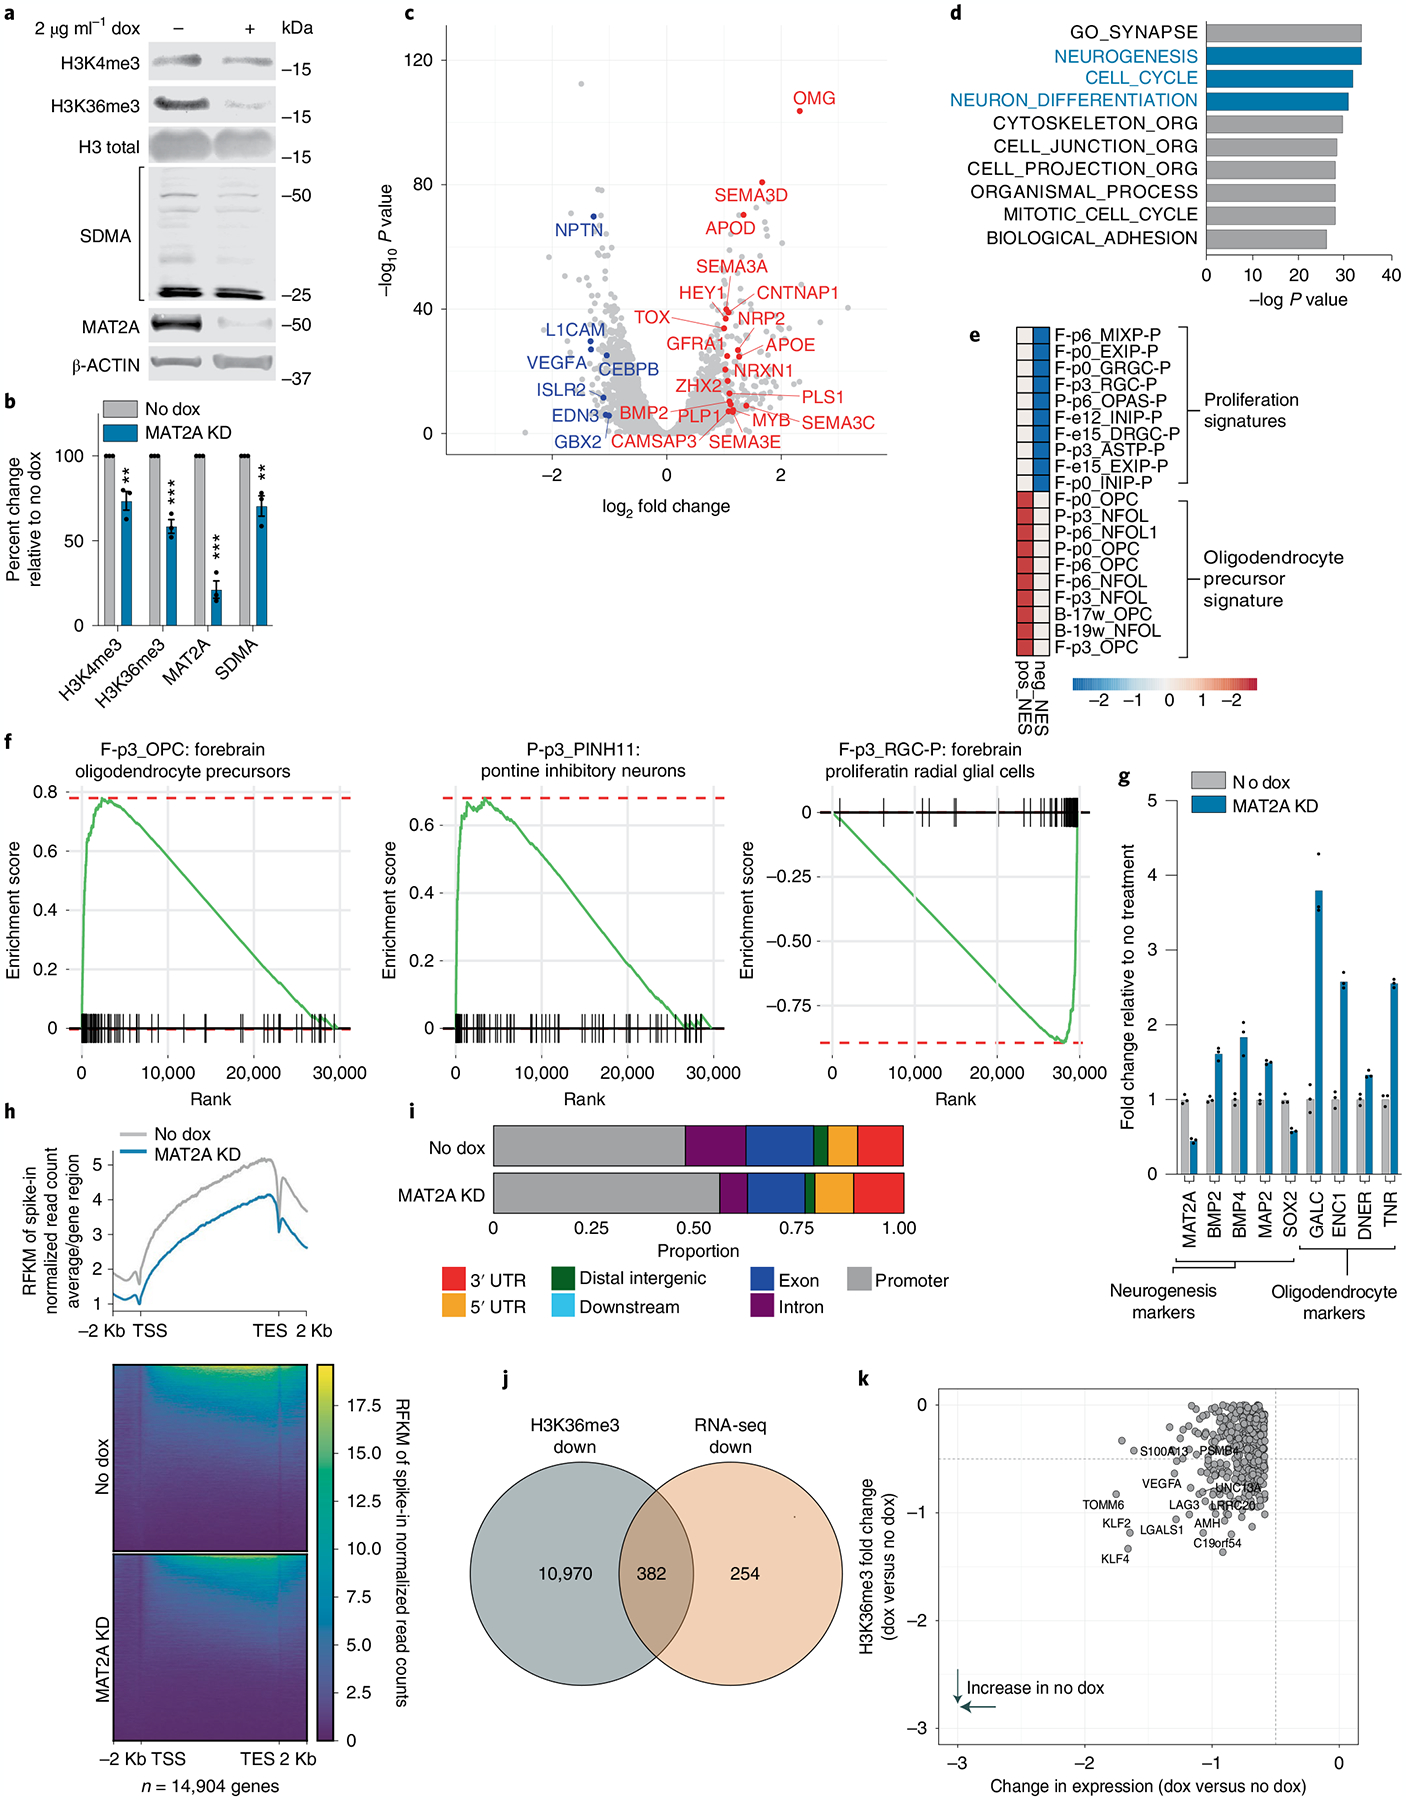
a, Quantitative western blotting of histone modifications (H3K4me3 and H3K36me3) and SDMA in DIPG13p cells comparing MAT2A knockdown to control cells. b, Quantification of histone modifications (H3K4me3 and H3K36me3), SDMA and MAT2A using Li-Cor fluorescent system for DIPG13p cells, MAT2A knockdown versus control cells. Experiments were performed in biological triplicate; samples were repeatedly measured three times. Statistical analysis was performed using a two-tailed, unpaired t-test. Data displayed as mean ± s.e.m. (no dox versus MAT2A knockdown H3K4me3 **P = 0.008283; H3K36me3 ***P = 0.000501; MAT2A ***P = 0.000103; and SDMA **P = 0.00792). c, Volcano plot of differential gene expression comparing MAT2A knockdown to control cells. Canonical neuronal markers are highlighted in red (upregulated) and blue (downregulated). Statistical adjustments were made for multiple comparisons using iDEP.94 DESeq2 Statistical packages in R. d, Top ten gene sets (GO), derived from GSEA analysis of changes to the transcriptome in MAT2A knockdown. e, Heat map of top ten negative and positive enriching developmental cell signatures in MAT2A knockdown. f, Enrichment plots of selected developmental cell signatures from e. g, Real-time PCR validation of selected canonical neurogenesis genes and markers of oligodendrocyte cells. n = 3 technical triplicates for each gene. h, Heat map of spike-in normalized H3K36me3 ChIP-Rx-seq reads centered at human genes in no dox (top) versus dox (bottom) induction of MAT2A shRNA expression in DIPG13p cells. TSS, (Transcription Start Site); TES, (Transcription End Site). i, Bar plots of H3K36me3 ChIP-Rx-seq reads demonstrating alterations of H3K36me3 at different regions summarized across all human genes in DIPG13p cells. j, Venn diagram of overlapping genes between ChIP-Rx-seq and RNA-seq data. k, Plot of H3K36me3 (fold change) versus RNA-seq (fold change), neurogenesis makers are indicated.