


Fig. 5 |. Silencing MAT2a inhibits patient-derived DIPG lines.
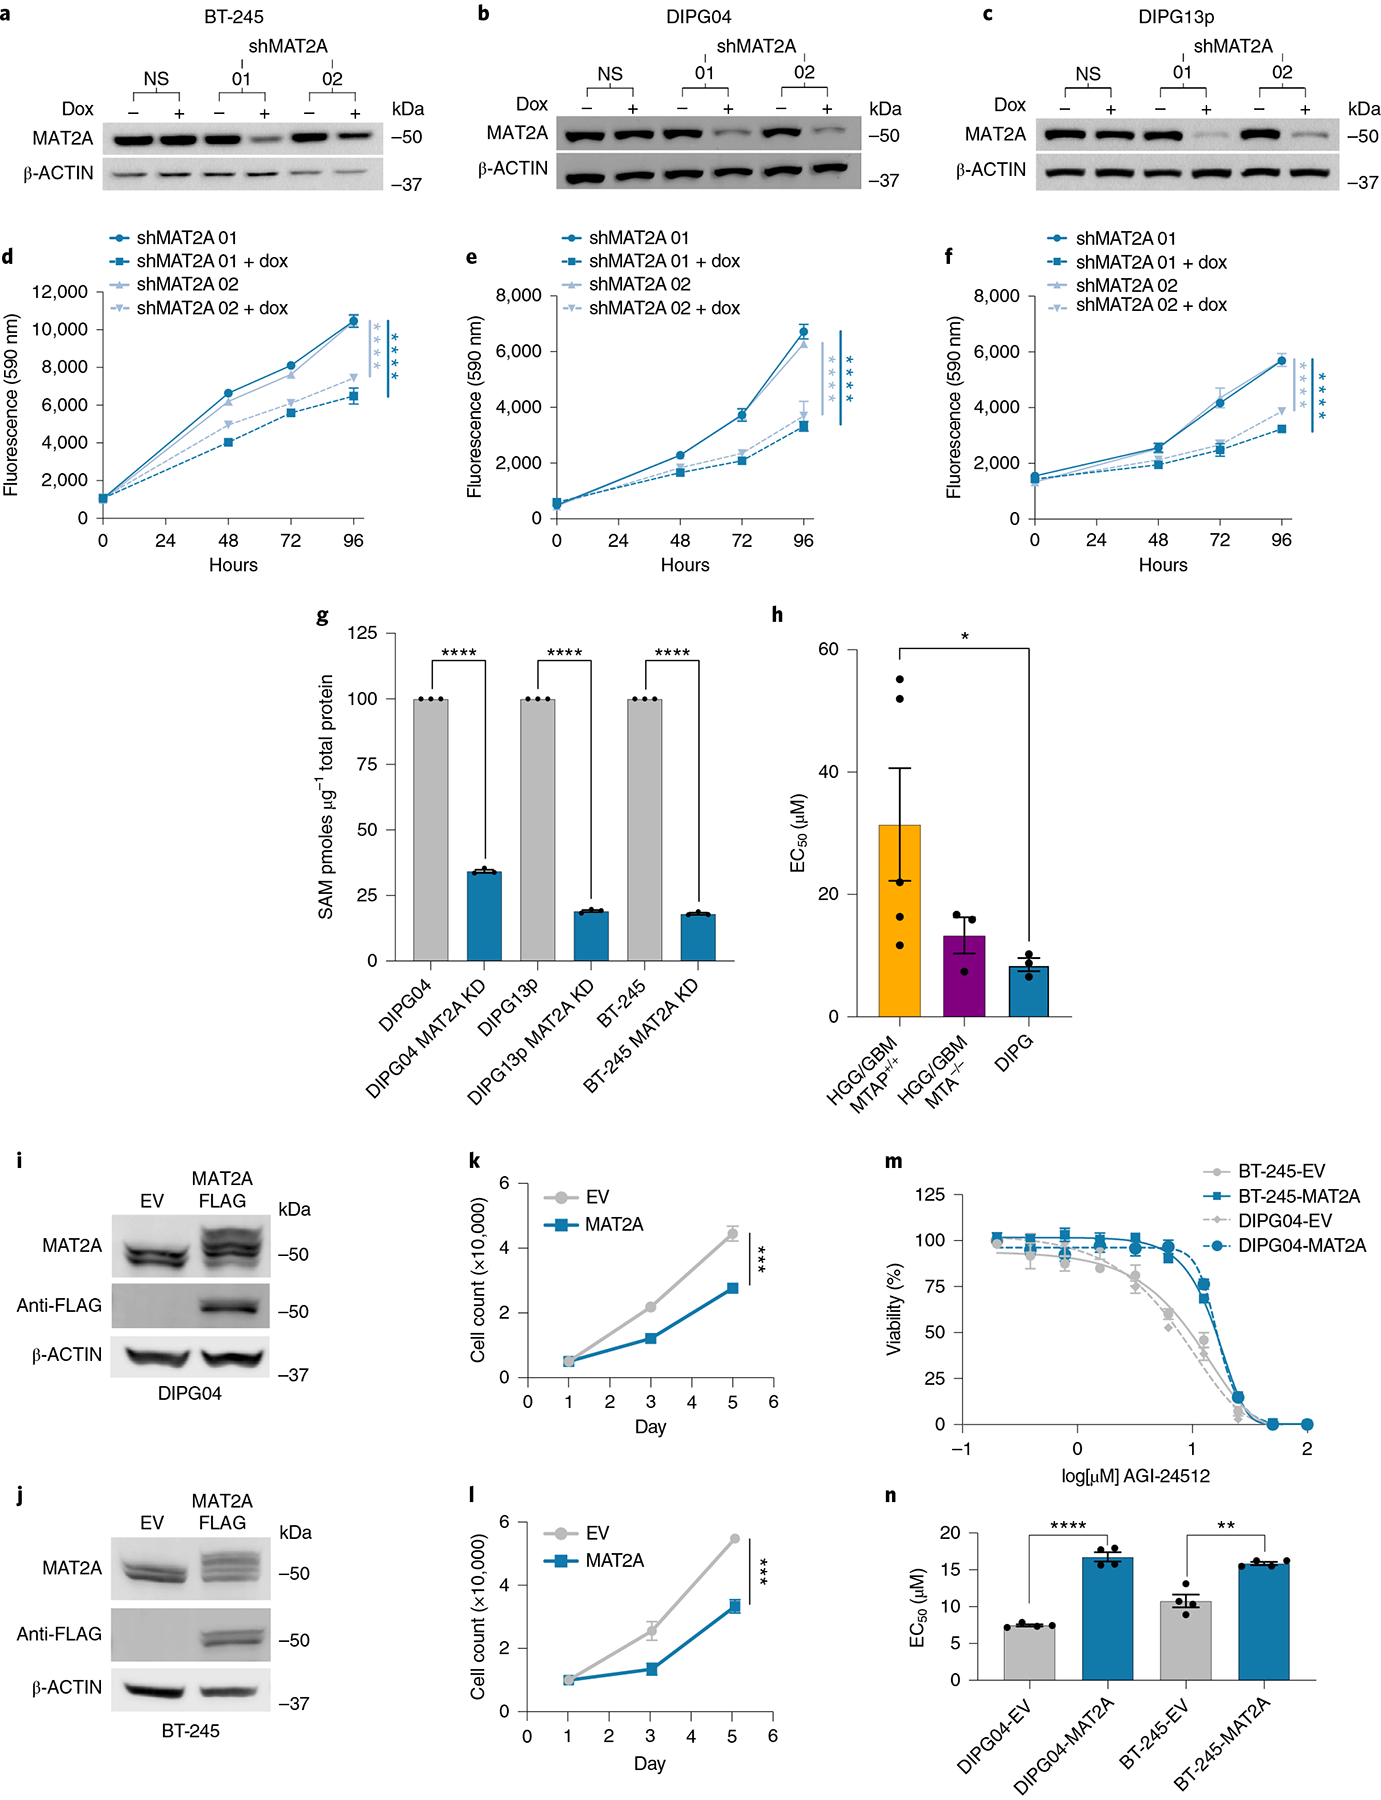
a–c, Western blot confirming knockdown of MAT2A using dox-inducible shRNA. BT-245 (a), DIPG04 (b) and DIPG13p (c) cells were treated with dox for 120 h. d–f, Alamar blue, cell viability assay of BT-245 (d), DIPG04 (e) and DIPG13p (f) cells treated with or without dox (MAT2A knockdown). Cell growth was evaluated over 4 d. Experiments were performed in four biological replicates. BT-245 (shMAT2A01 versus shMAT2A01 + dox ****P = 0.000014) and (shMAT2A02 versus shMAT2A02 + dox ****P < 0.000001) (d). DIPG04 (shMAT2A01 versus shMAT2A01 + dox ****P = 0.000067) and (shMAT2A02 versus shMAT2A02 + dox ****P < 0.000001) (e). DIPG13p (shMAT2A01 versus shMAT2A01 + dox ****P = 0.000032) and (shMAT2A02 versus shMAT2A02 + dox ****P < 0.000001) (f). g, MS-based quantification of SAM between control and MAT2A knockdown cells. n = 3 biological replicates for each condition (DIPG04 versus DIPG04 MAT2A knockdown ****P < 0.0001; DIPG13p versus DIPG13p MAT2A knockdown ****P < 0.0001; and BT-245 versus BT-245 MAT2A knockdown ****P < 0.0001). h, Comparison of mean EC50 values across DMG, HGG/GBM-MTAP-deleted and wild-type (WT) cell lines (n = 5 GBM-MTAP+/+, n = 3 GBM-MTAP−/−, n = 3 DIPG). Statistical analysis was performed using two-tailed Mann–Whitney U-test. Data are displayed as mean ± s.e.m. (HGG/GBM MTAP+/+ versus DIPG *P = 0.0357; P > 0.05 not displayed). i,j, Western blot of DMG cell lines expressing MAT2A–FLAG DIPG04 (i) and BT-245 (j). k,l, Cell count of DMG cell lines expressing MAT2A–FLAG DIPG04 (k) and BT-245 (l). Experiments performed were in biological triplicate. Statistical analysis was performed at day 5 (DIPG04–EV versus DIPG04–MAT2A–FLAG ***P = 0.000121 (k) and BT-245-EV versus BT-245–MAT2A–FLAG ***P = 0.000325 (l)). m, MAT2A inhibitor (AGI-24512) dose–response of DMG cell lines, DIPG04 and BT-245 expressing MAT2A–FLAG compared to control lines. Experiments were performed in biological sextuplicate. Data are displayed as mean ± s.e.m. n, Comparison of EC50 values of DMG cell lines, DIPG04 and BT-245 expressing MAT2A–FLAG compared to isogenic controls. Experiments were performed in biological quadruplicate (DIPG04–EV versus DIPG04–MAT2A–FLAG ****P < 0.0001; and BT-245–EV versus BT-245–MAT2A–FLAG **P = 0.0013). *P < 0.05, **P < 0.01, ***P < 0.001, ****P < 0.0001. Western blots were performed in biological triplicate (a–c,i,j). Statistical analysis was performed using a two-tailed, unpaired t-test (d–g,k,l,n). Data are displayed as mean ± s.e.m.