


Fig. 4 |. MAT2A expression is lower in DIPGs.
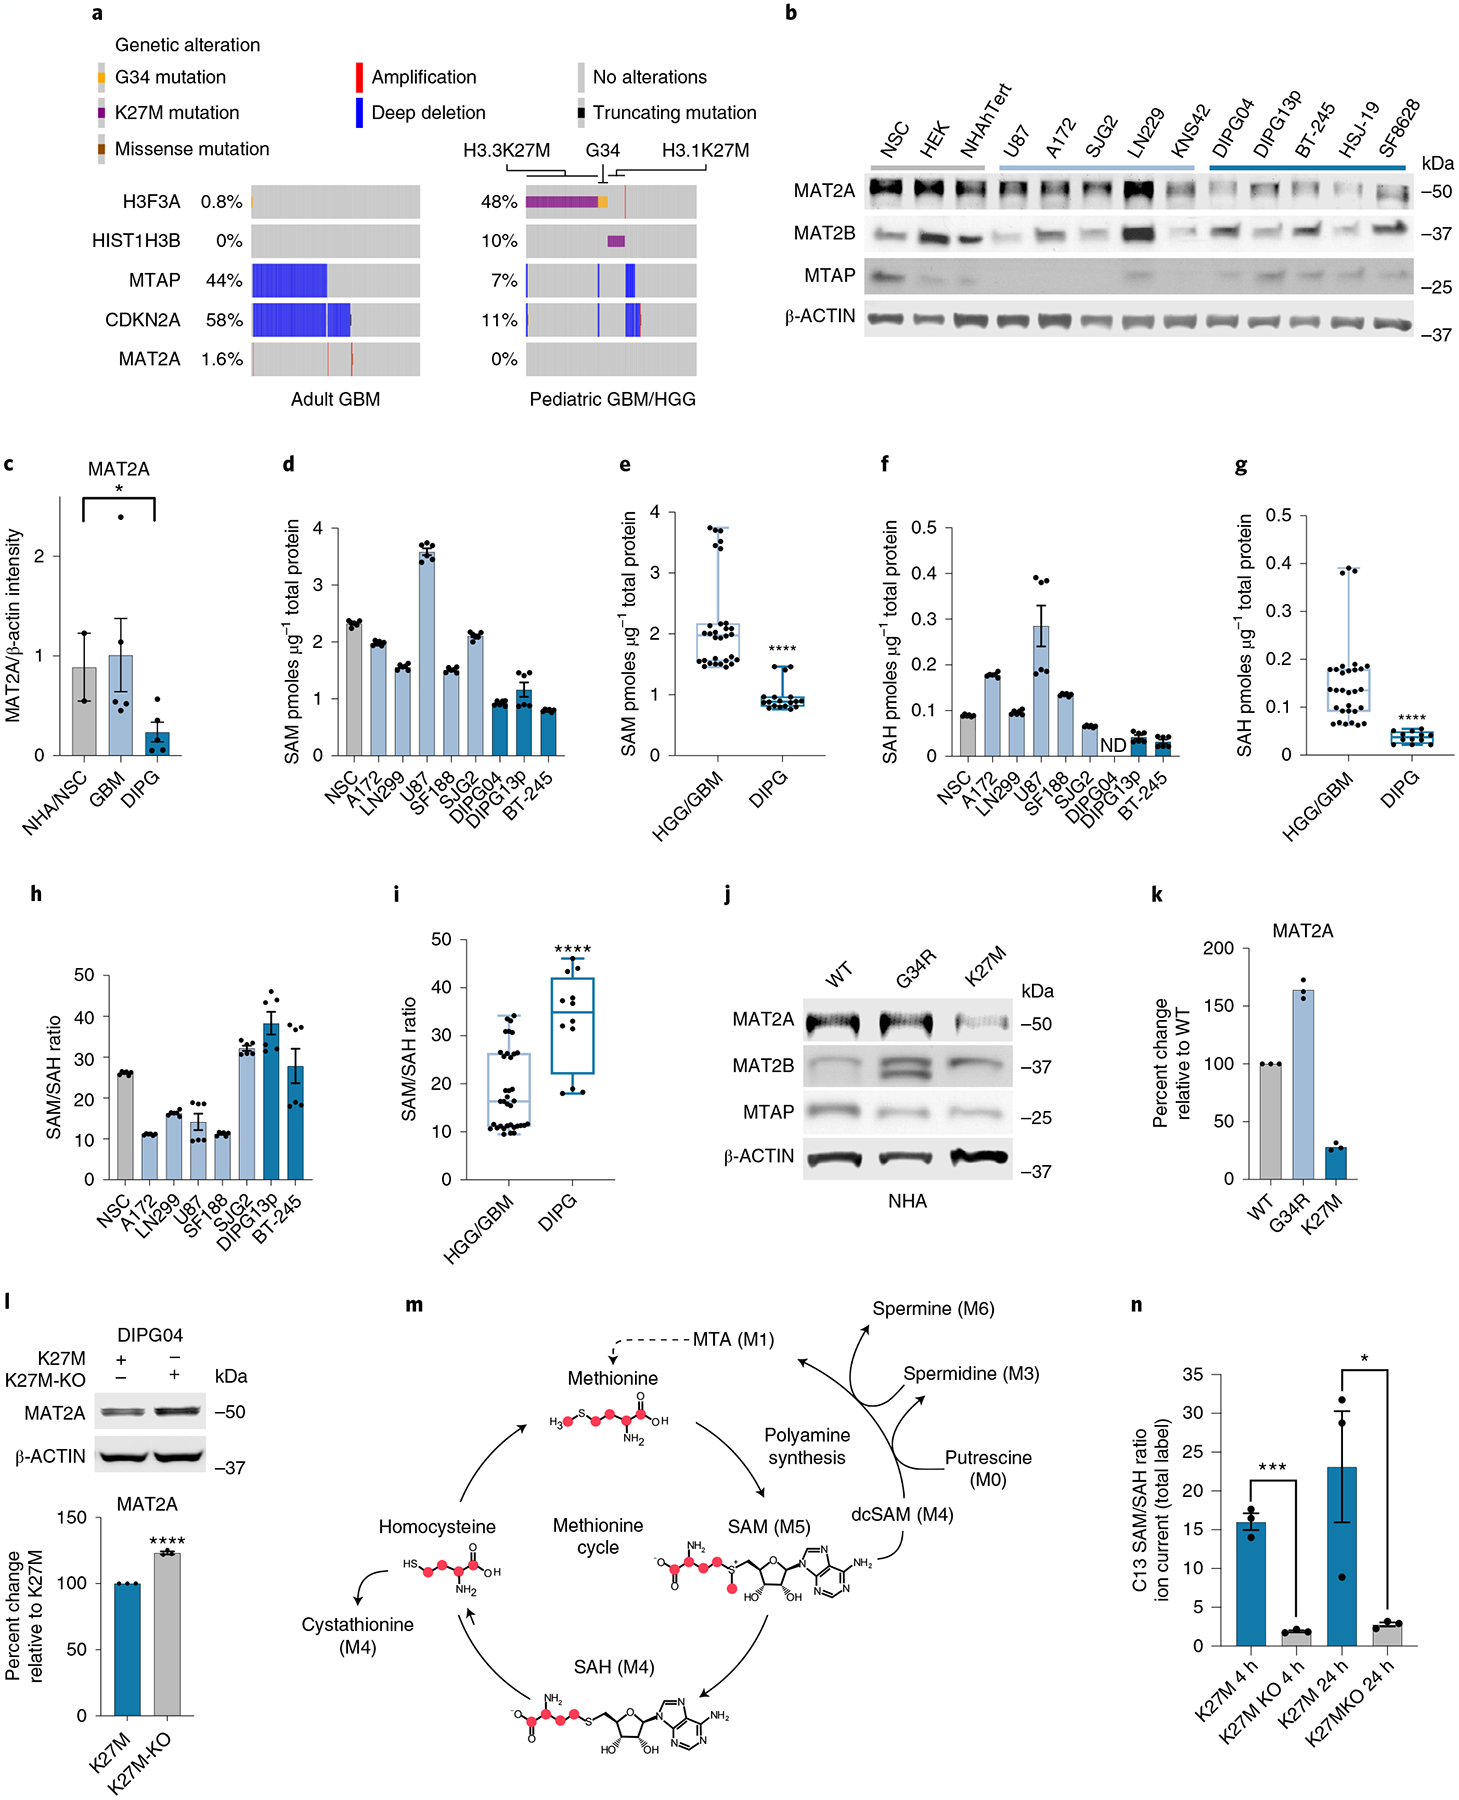
a, Oncoprint visualizing MTAP deletion in adult GBM (TCGA PanCancer Atlas)68 and PHGG dataset (ICR London)24. Data were generated using the PedcBioPortal69,70. b, Quantitative western blotting of proteins involved in methionine metabolism in DMG, PHGG, aGBM and control cells. This experiment was performed in biological duplicate. c, Quantification of western blots using LI-COR fluorescent secondary antibodies with the LI-COR Odyssey Clx Imaging System. Quantification was performed in the linear range through Image Studio Lite (v.5.2). Healthy brain n = 2, GBM n = 5 and DIPG n = 5. Biological samples were measured three times and the average intensity was plotted for each biological replicate. Healthy brain versus DIPG *P = 0.0447; P > 0.05 not shown. d–g, MS-based quantification of SAM (d) and SAH (f) across DMG, HGG and control cells. DIPG04 SAH was below the detectable threshold and designated as not detected (ND). Comparison of mean quantifications of SAM (e) between three DMG and five HGG cell lines (n = 6 biological replicates/cell line) (****P ≤ 0.0001). Comparison of mean quantifications of SAH between DMG and HGG groups (g). Statistical analysis was performed on five GBM cell lines and two DIPG cell lines (n = 6 biological replicates per cell line; ****P < 0.0001). h,i, Ratio of SAM/SAH in DMG, HGG and control cells (h). Comparison of mean SAM/SAH ratio between five GBM cell lines and two DIPG cell lines (n = 6 biological replicates per cell line) (****P < 0.0001) (i). j,k, Quantitative western blot of NHAs expressing wild-type, H3.3 G34R (hemispheric pHGG histone mutation) or H3K27M mutations (j). Quantification of western blots using Li-Cor fluorescent system of j (k). Samples were repeatedly measured in technical triplicates. l, Western blot of MAT2A in CRISPR-corrected H3K27M KO DIPG04 versus K27M control. Quantification of western blots using LI-COR fluorescent system (bottom). n = 3 biological replicates. Biological samples were measured three times and the average intensity was plotted for each biological replicate (****P < 0.0001). m, C13 labeling of methionine with respective isotope derivatives. n, Ratio of SAM/SAH derived from C13 methionine labeling flux analysis of CRISPR-corrected DIPG04 versus DIPG04 control. n = 3 biological replicates for each cell line (K27M versus K27MKO at 4 h ***P = 0.0002; and K27M versus K27MKO 24 h *P = 0.0471). *P < 0.05, **P < 0.01, ***P < 0.001. Box and whiskers are defined by the center line denoting the median and the lower and upper ends of the box denote the 25th and 75th percentiles, respectively (e,g,i). The whiskers indicate the maximum and the minimum values of the data distribution. Statistical analysis was performed using an unpaired, two-tailed t-test (c,e,g,i,l,n). Data are displayed as mean ± s.e.m. (c,d,f,h,l,n).