


Fig. 2 |. Transcriptional profiling identifies alteration in methionine metabolism in DMG.
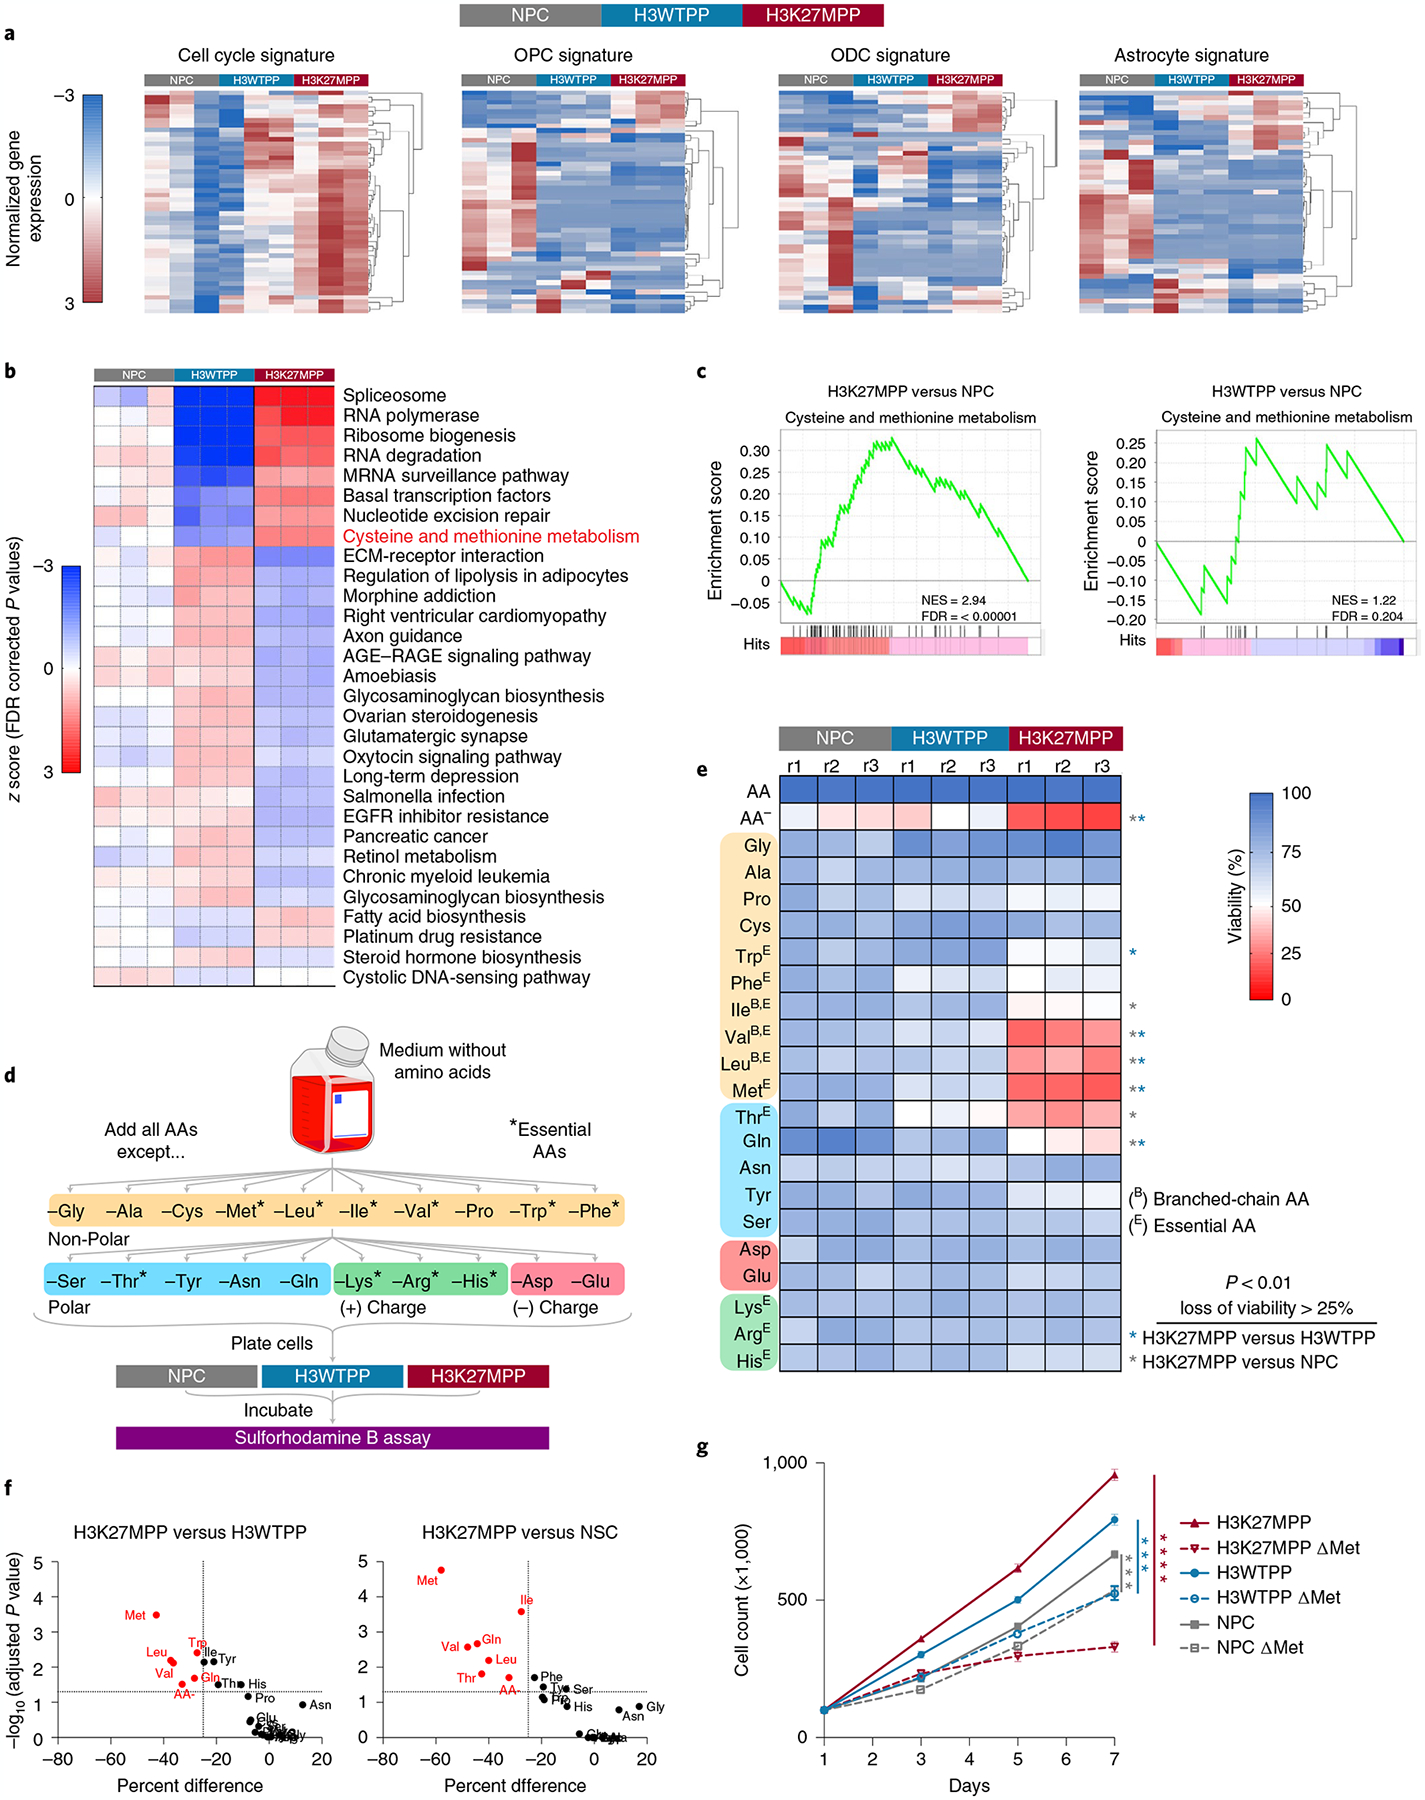
a, Hierarchical clustering (HCL) of 1,500 most variable genes among H3K27MPP cells, H3WTPP cells and OLIG2-positive NPCs. b, KEGG pathway analysis comparing NPC, H3WTPP, and H3K27MPP cells. The P values were corrected for multiple testing using FDR. c, GSEA plots of H3K27MPP and H3WTPP cells compared to NPC control cells for cysteine and methionine metabolism. d, Schematic of AA dropout screen, where AAs are grouped by their properties and essentiality. e, AA dropout screen in control OLIG2-positive NPCs, H3K27MPP cells and H3WTPP cells. The screen was performed in biological triplicate with technical replicates of n = 3. P values are provided for AAs that resulted in >25% loss of viability compared to control (H3K27MPP versus H3WTPP Met P = 0.000014, Trp P = 0.000185, Leu P = 0.000321, Val P = 0.00045, Gln P = 0.001304, AA− P = 0.00207; H3K27MPP versus NSC Met P = 0.000001, Ile P = 0.000013, Gln P = 0.000108, Val P = 0.000141, Leu P = 0.000357, Thr P = 0.000915, AA− P = 0.002651). f, Graphical representation of data in e plotted to percentage difference in viability against −log10(adjusted P value). Comparison of H3K27MPP versus H3WTPP (left), comparison of H3K27MPP versus NSC (right). g, Direct cell counts of control, H3WTPP and H3K27MPP cells in control and methionine-depleted medium. Experiments were performed in biological triplicate. Statistical analysis was performed on day 7 using an unpaired, two-tailed t-test. Data are represented as the mean ± s.e.m. (H3K27MPP versus H3K27MPP + MR P = 0.000003; H3WTPP versus H3WTPP + MR P = 0.000145; and NSC versus NSC + MR P = 0.000479). *P < 0.05, **P < 0.01, ***P < 0.001, ****P < 0.0001. Data in a–c were analyzed from RNA-sequencing performed in biological triplicate for each condition. Statistical analysis was performed using multiple unpaired t-tests and the Holm–Šídák method was used for multiple comparisons (e,f).