


Extended Data Figure 4 |. SNP-SELEX results are correlated with TF binding in vitro and in vivo.
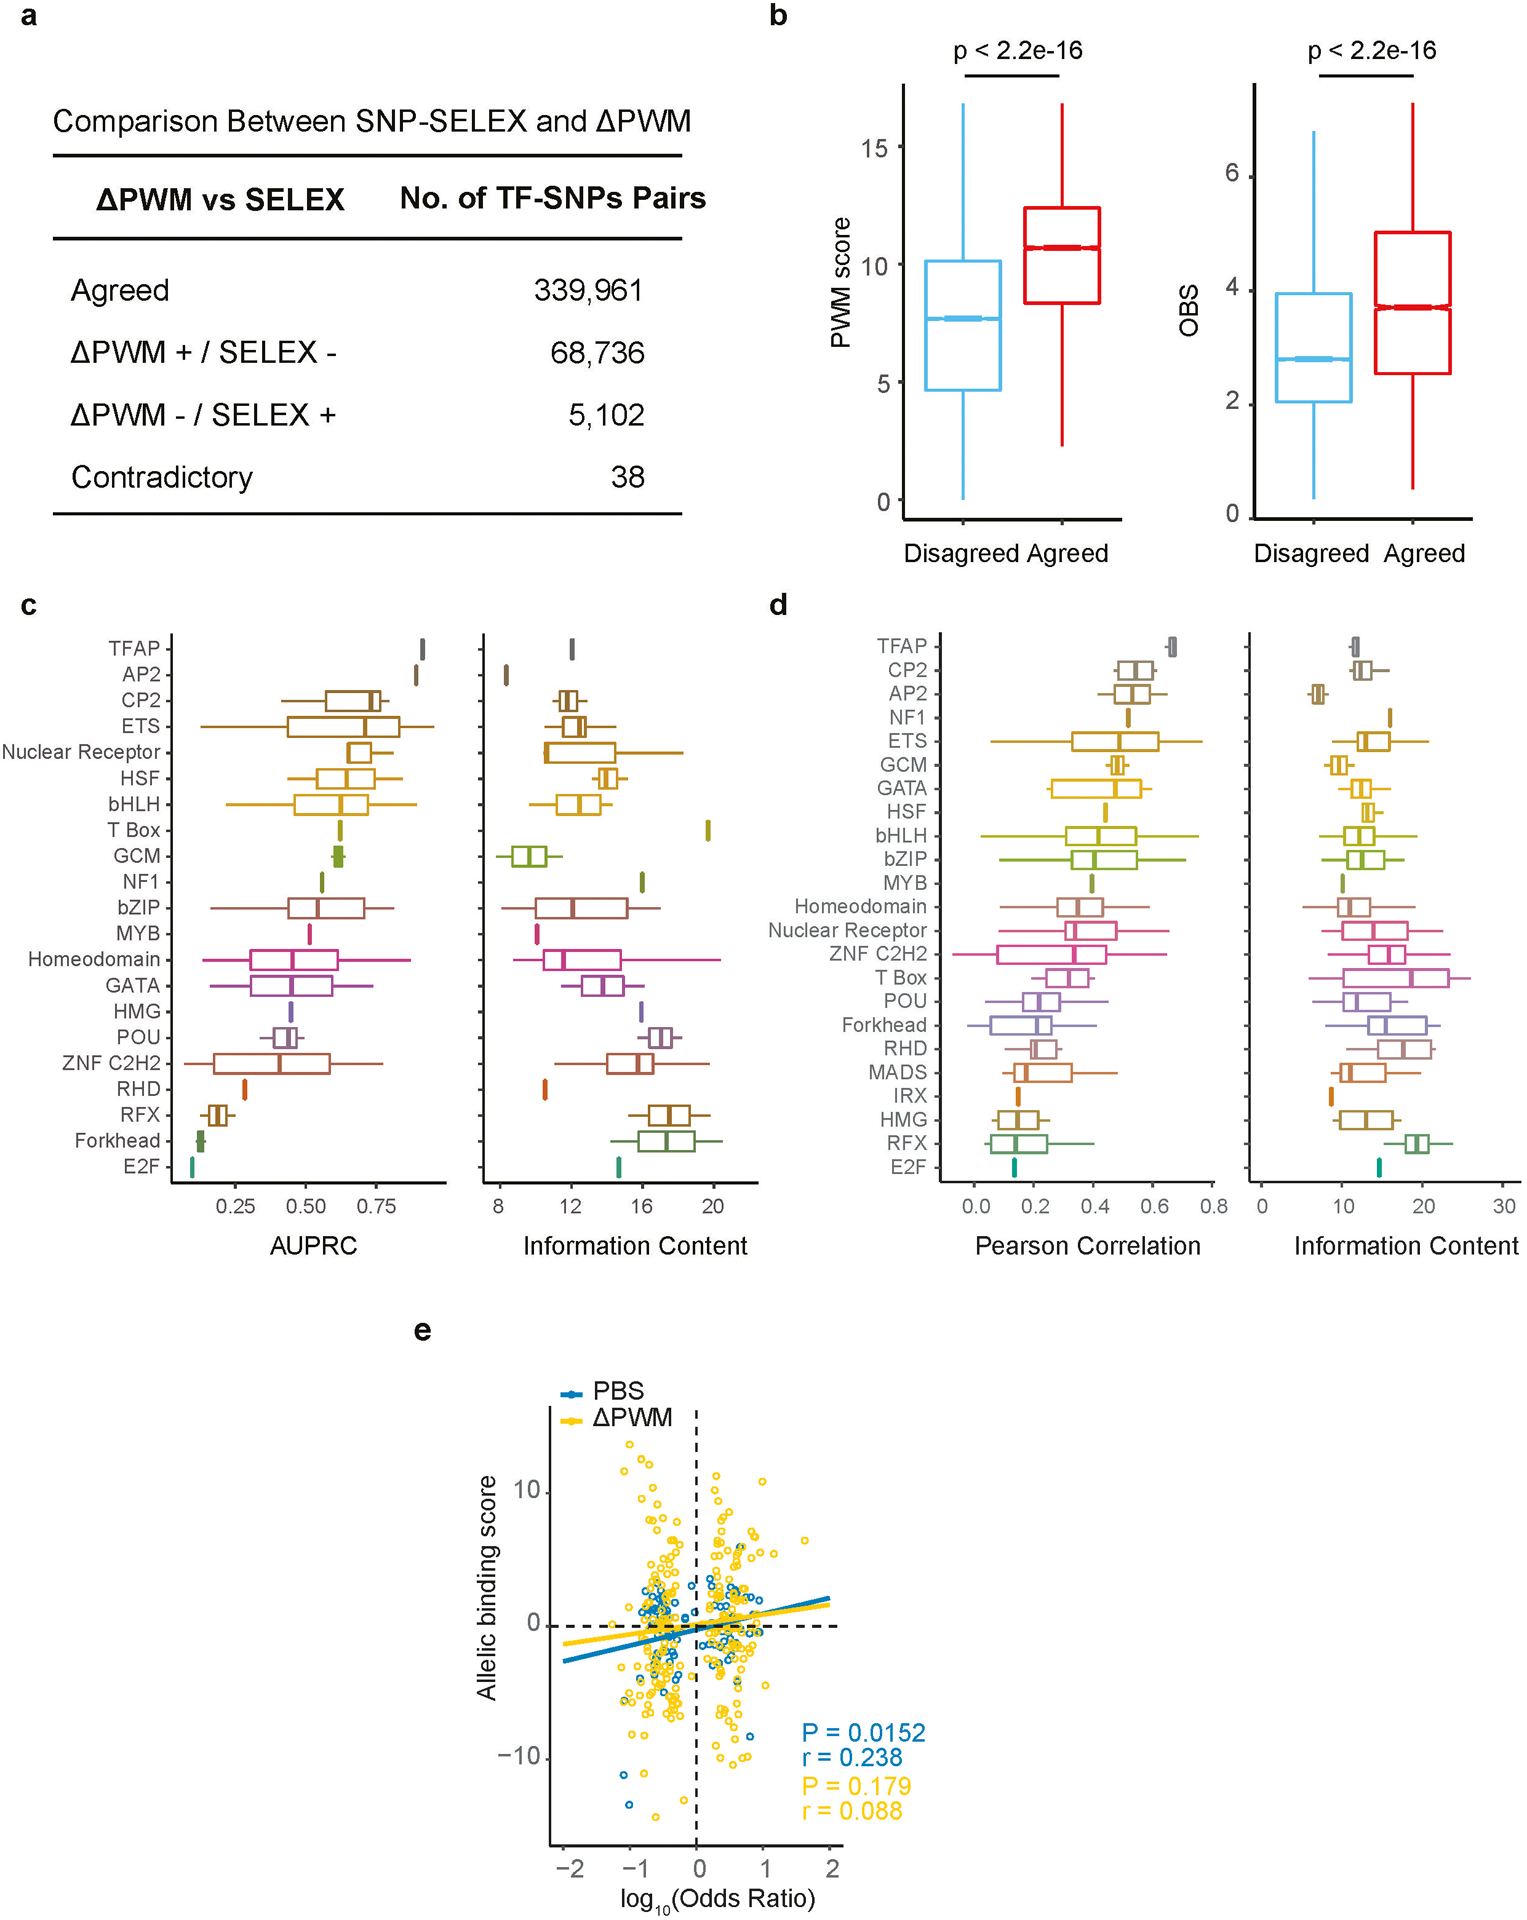
(a) Comparison of the SNPs with differential TF binding determined by SNP-SELEX and ΔPWM. An error matrix table showing the number of SNPs for which the same allele was identified as the preferred allele by both methods (Agreed), SNPs for which one allele was determined as preferential substrate by one method but no allele was called by the other (PWM+/ SNP-SELEX− and PWM−/ SNP-SELEX+), and SNPs where different alleles were called as preferential bound by each method (Contradictory). Note that the vast majority of the results agreed, with the most disagreement coming from PWM+/ SNP-SELEX−.
(b) Comparison of the PWM scores (left) and the OBS scores (right) between SNPs with concordant and discordant predictions. Note that discordant predictions mostly come from weak binding sites with low PWM scores and low OBS scores. Two-sided Mann-Whitney U test p-value is shown on the top. Horizontal line is median; hinges are 25th and 75th percentile; whiskers are most extreme value no further than 1.5 * IQR.
(c) Boxplots show performance of ΔPWM in predicting pbSNPs grouped by DNA binding domain structural families (left) and information content of motifs for each corresponding TF family (right). AUPRC (area under the precision-recall curve) is used to evaluate the performance of ΔPWM. Horizontal line is median; hinges are 25th and 75th percentile; whiskers are most extreme value no further than 1.5 * IQR.
(d) Boxplots show Pearson Correlation Coefficients (PCC) between PBS and ΔPWM (left) and information content (right) for each TF family. PCCs for some TF families are higher than others, independent of the information content (IC) of corresponding PWM models. Horizontal line is median; hinges are 25th and 75th percentile; whiskers are most extreme value no further than 1.5 * IQR.
(e) A scatterplot shows the correlation of PBS and allelic binding ratio derived from SNP-SELEX and ChIP-seq in GM12878 cells respectively. The PCCs and p-values calculated based on t-test are shown on the lower right corner. The allelic binding ratio is computed as the log10 odd ratio over input (see Methods for details). In total, 341 TF-SNP pairs including 269 unique SNPs and six TFs were plotted. TFs used include ATF2, PKNOX1, IRF3, NR2F1, YBX1, and TBX21.