


FIGURE 4.
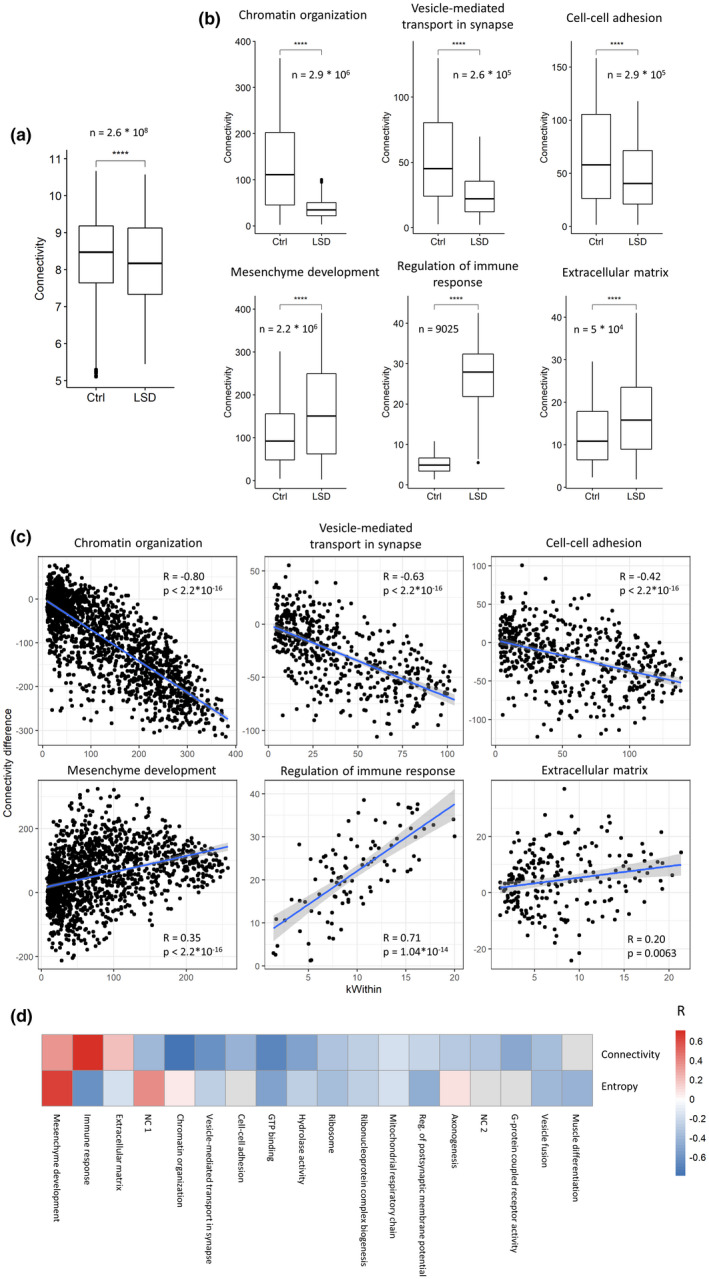
Different modules differently reorganise their structure upon LSD. (a) The overall network connectivity decreases in the LSD condition (n = 2.6 * 108, number of genes’ pairwise correlations per treatment group); (b) connectivity changes in the LSD‐induced modules and in three additional modules showing opposite trend (n = number of genes’ pairwise correlations per module per treatment group); (c) Gene‐wise relationship between change in connectivity and network centrality, measured as the intramodular connectivity (kWIthin). Together with each scatter plot, Pearson's correlations and p‐values are reported. (d) Heatmap summarising the correlation between node's centrality and connectivity change (first row) or entropy change (second row) for each module. Red indicates positive and blue indicates negative correlation. Non‐significant correlations are shown in grey