



Abstract
Purpose
We aimed to explore the relationship between the cardiometabolic index (CMI) and cardiovascular disease (CVD) and its subtypes (coronary artery disease and stroke) in patients with hypertension and obstructive sleep apnea (OSA).
Methods
We conducted a retrospective cohort study enrolling 2067 participants from the Urumqi Research on Sleep Apnea and Hypertension study. The CMI was calculated as triglyceride to high‐density lipoprotein cholesterol ratio × waist‐to‐height ratio. Participants were divided into three groups (T1, T2, and T3) according to the tertile of CMI. The Kaplan-Meier method helped to calculate the cumulative incidence of CVD in different groups. We assessed the association of CMI with the risk of CVD and CVD subtypes by estimating hazard ratios (HRs) and 95% confidence intervals (CIs) using Cox models.
Results
During a median follow-up of 6.83 years (interquartile range: 5.92-8.00 years), 326 incident CVD were identified, including 121 incident stroke and 205 incident coronary heart disease (CHD). Overall, after adjusting for confounding variables, CMI was positively associated with the risk of new-onset CVD (per SD increment, adjusted HR: 1.31; 95% CI: 1.20, 1.43), new-onset CHD (per SD increment, adjusted HR: 1.33; 95% CI: 1.20, 1.48), and new-onset stroke (per SD increment, adjusted HR: 1.27; 95% CI: 1.10, 1.47). Similar results were obtained in various subgroup and sensitivity analyses. Adding CMI to the baseline risk model for CVD improved the C-index (P < 0.001), continuous net reclassification improvement (P < 0.001), and integrated discrimination index (P < 0.001). Similar results were observed for CHD and stroke.
Conclusion
There was a positive association between CMI levels and the risk of new-onset CVD in patients with hypertension and OSA. This finding suggests that CMI may help identify people at high risk of developing CVD.
1. Introduction
According to epidemiological studies, cardiovascular disease (CVD) has been the leading cause of morbidity and mortality of chronic noncommunicable diseases worldwide, with coronary heart disease (CHD) and stroke being the leading causes of CVD [1]. In 2016, there were more than 290 million cases of CVD in China, including 1.736 million deaths from coronary heart disease and 4.344 million deaths from stroke, causing a profound socioeconomic burden on society [2, 3]. Currently, both hypertension and obstructive sleep apnea (OSA) are considered to be significant independent risk factors for CVD [4–8]. Furthermore, the coexistence of OSA and hypertension further increases the risk of CVD [9–11]. Therefore, there is a requirement to identify hypertensive patients with OSA who are at high risk for CVD to provide more cost-effective care and facilitate service policy planning.
Epidemiological and pathophysiological studies have shown that the accumulation of visceral adipose tissue (VAT) is associated with a variety of CVD risk factors, including type 2 diabetes, hypertension, and metabolic syndrome [12–16]. Nowadays, imaging techniques, such as computed tomography, dual-energy X-ray absorptiometry, and magnetic resonance imaging, can accurately quantify the volume of VAT as well as the distribution of specific compartments [16–19]. However, these methods are not feasible in routine physical examinations because they are time-consuming and expensive and have radiation risks.
The cardiometabolic index (CMI), a recently developed index reflecting VAT distribution and dysfunction, is useful in assessing the risk of obesity-related metabolic diseases such as diabetes, hypertension, left ventricular hypertrophy, and stroke [20–25]. CMI consists of anthropometric and biochemical indicators, including waist-to-height ratio (WHtR) and triglyceride to high-density lipoprotein cholesterol ratio (TG/HDL-C), which can be easily obtained during a health examination [26]. WHtR is considered a valuable parameter that reflects the function of subcutaneous adipose tissue (SAT) and VAT compartments [27–29]. TG/HDL-C is a simple marker that has been considered a good indicator of the risk of CVD and can closely reflect dyslipidemia and insulin resistance (IR) [30–32].
To our knowledge, there are few studies on the relationship between CMI and the risk of CVD, especially in hypertensive patients with OSA. Therefore, this study is aimed at investigating the relationship between CMI and the risk of CVD and its subtypes using data from the Urumqi Research on Sleep Apnea and Hypertension (UROSAH) study.
2. Methods
2.1. Study Population
All data were obtained from the UROSAH study, and a detailed description of the UROSAH study has been reported elsewhere [33]. In brief, UROSAH is a single-center, observational, retrospective cohort study designed to investigate the relationship between long-term cardiovascular outcomes in patients with hypertension and OSA. In this study, the study population was hypertensive patients diagnosed with OSA at the Hypertension Center of Xinjiang Uygur Autonomous Region People's Hospital between January 2011 and December 2013. Patients with a definite prior diagnosis of hypertension or with a newly diagnosed hypertension at admission, criteria of which were referred to guidelines from the Chinese Hypertension League, were considered to have hypertension. All patients were diagnosed with OSA after admission by laboratory nocturnal polysomnography (PSG), which was defined in detail following the relevant guidelines. Other inclusions and exclusion criteria are detailed in the flow chart (Figure 1). Overall, 2067 participants were ultimately included in this analysis after strict adherence to the inclusion and exclusion criteria.
Figure 1.

Flow chart of study participant selection.
2.2. Ethical Approval
The ethics application was approved by the Ethics Committee of the Xinjiang Uygur Autonomous Region People's Hospital (reference: 2019030662). All patients gave informed consent according to the Declaration of Helsinki.
2.3. Assessment of Covariates
Baseline data collection was expected to be completed by professional research staff following the operational procedures mentioned in previous studies [33]. One-on-one interviews were held with each participant using a standardized electronic medical record. Diabetes was defined as fasting glucose ≥ 7.0 mmol/L, use of any glucose-lowering medication, or self-reported history of diabetes. Regular continuous positive airway pressure (CPAP) treatment was defined as the use of CPAP therapy for more than 70% of nights throughout the follow-up period and no less than 4 hours per night, or an average of ≥4 hours per night [34, 35]. Similar to the definition of CPAP treatment use, subjects with at least 4 hours of use per night and at least 70% of nights of continuous use were considered to be regular oral appliance treatment users [36].
2.4. Laboratory Assays
On the morning of the survey, venous blood samples were harvested after an overnight fast (>8 hours) and sent to the central laboratory for analysis shortly after sampling. All biochemical measurements including total cholesterol (TC), TG, HDL-C, low-density lipoprotein cholesterol (LDL-C), and fasting plasma glucose (FPG) were measured on a fully automated biochemical analyzer (Hitachi 7600; Japan). The estimated glomerular filtration rate (eGFR) was derived by using the equations of the Chronic Kidney Disease Epidemiology Collaborative Group [37].
2.5. Calculation of CMI
The TG/HDL-C ratio was computed by dividing the serum concentration of TG (mmol/L) by HDL-C (mmol/L). WHtR was derived by dividing WC (cm) by height (cm). CMI was computed as TG/HDL‐C × WHtR according to the formula in previously published papers [26].
2.6. OSA Evaluation
All participants underwent nocturnal PSG monitoring in the sleep laboratory. All sleep monitoring results were analyzed by specialized sleep technicians according to criteria [38, 39]. Details of the PSG and scoring criteria applied in this research are available in the Supplementary Material. OSA was defined as an apnea-hypopnea index (AHI) of ≥5 events/h. The severity of OSA was classified as normal (<5), mild (5-14.9), moderate (15-29.9), and severe (≥30) according to the AHI [39, 40].
2.7. Endpoints and Follow-Up
In this study, the primary outcome was new-onset cardiovascular disease (CVD), including stroke and coronary heart disease (CHD). Cardiologists from the Clinical Events Committee of a tertiary care hospital diagnose CVD after reviewing all medical records. CHD was defined as myocardial infarction (fatal or nonfatal), coronary revascularization (percutaneous transluminal coronary angioplasty or coronary artery bypass grafting), and angina pectoris (unstable or stable), which were diagnosed by electrocardiogram, signs or symptoms of ischemia, or diagnostic enzymes. A stroke was defined as a sudden or rapid onset of focal neurological deficit lasting longer than 24 hours or until death. The diagnosis was confirmed by computed tomography scan, magnetic resonance imaging, or the patient's clinical symptoms. Stroke includes both ischemic and hemorrhagic strokes. After entry into this cohort, subjects were followed up for the first occurrence of CVD. Follow-up results were available through outpatient interviews, telephone interviews, and inpatient medical records. Deaths due to CVD were verified by hospital death certificates or hospitalization data or by the local police system. The follow-up period began with the initial visit and continued until the participant had a new onset of CVD or died (whichever occurred first), otherwise until the end of the follow-up period in January 2021.
2.8. Statistical Analysis
Means ± standard deviation (SD), medians (Q25, Q75), or proportions were illustrated for characteristics of the participants by CMI tertiles. Differences in group characteristics were compared by using Fisher's exact test, ANOVA test, Kruskal-Wallis test, or χ2 test, accordingly. Kaplan-Meier curves and log-rank tests were used to present the unadjusted cumulative hazards across the tertiles of CMI.
Multicollinearity among the variables was tested by calculating the variance inflation factor (VIF). Variables with VIF > 5 were considered to have severe multicollinearity and could not be incorporated in the multivariate regression analysis. Hazard ratios (HRs) and 95% confidence intervals (CIs) of new-onset CVD or its subtypes (CHD and stroke) in relation to CMI (continuous, tertiles, and categories) were calculated through the use of Cox proportional hazards models. Model 1 was adjusted for age and sex; Model 2 was further adjusted for drinking status, history of diabetes, smoking status, DBP, SBP, and BMI; Model 3 was further adjusted for all noncollinear variables. After entering the median CMI values of each tertile into the model and treating them as continuous variables, the regression model was tested for trend. To test the robustness of our results, we performed several sensitivity analyses. First, we excluded participants who were current smokers and alcohol drinkers and repeated the analysis. Second, we excluded participants who were regularly receiving CPAP treatment. Third, we excluded events that occurred one year prior to follow-up to minimize potential reverse causes. Finally, non-CVD deaths were considered a competing risk, and we performed a competing risk regression analysis based on the methods reported by Fine and Gray. Furthermore, we explored the relationship between the CMI and new-onset CVD, CHD, and stroke using a generalized additive model and smoothed curve fitting.
Stratified analyses and interactions were separately performed by age (<60 or ≥60years), sex (female or male), SBP (<140 or ≥140 mmHg), BMI (<28 or ≥28 kg/m2), smoking (never, past, or current), DBP (<90 or ≥90 mmHg), drinking (never, past, or current), and AHI (≥30, ≥15 to <30, or ≥5 to <15 events/h).
Receiver operating characteristic (ROC) curves were used to estimate the predictive values of possible predictors for endpoints (CVD, CHD, and stroke). The C-index, continuous net reclassification improvement (NRI), and integrated discrimination index (IDI) were used to evaluate the additional predictive value of the CMI beyond established risk factors. Confidence intervals for C-index, continuous NRI, and IDI were estimated using 1000 bootstrap procedures.
All analyses were undertaken with R software (version 4.0.1). The threshold of significance was fixed at 5% (P < 0.05 was significant).
3. Results
3.1. Baseline Characteristics of Participants
A total of 2067 eligible subjects with a mean age of 49.51 ± 10.73 years were included in this study, of which 68.92% were male. Baseline characteristics of subjects according to CMI tertile are presented in Table 1. Participants in the other groups were more likely to be younger, male, more current smokers, and drinkers; have a higher prevalence of diabetes; and have a higher BMI, eGFR, TC, TG, FPG, and AHI levels and a lower HDL-C level compared to the tertile 1 group.
Table 1.
Characteristics among patients, stratified by CMI.
| Characteristics | Tertile 1 (<0.73) |
Tertile 2 (≥0.73 to <1.21) |
Tertile 3 (≥1.21) |
P value |
|---|---|---|---|---|
| N | 689 | 689 | 689 | |
| Age (years) | 52.13 ± 11.41 | 49.05 ± 10.87 | 47.52 ± 9.43 | <0.001 |
| Male, n (%) | 387 (56.17%) | 480 (69.67%) | 521 (75.62%) | <0.001 |
| History of diabetes, n (%) | 88 (12.77%) | 115 (16.69%) | 141 (20.46%) | <0.001 |
| Smoking status, n (%) | <0.001 | |||
| Never | 491 (71.26%) | 382 (55.44%) | 347 (50.36%) | |
| Past | 64 (9.29%) | 73 (10.60%) | 70 (10.16%) | |
| Current | 134 (19.45%) | 234 (33.96%) | 272 (39.48%) | |
| Drinking status, n (%) | <0.001 | |||
| Never | 497 (72.13%) | 393 (57.04%) | 383 (55.59%) | |
| Past | 28 (4.06%) | 65 (9.43%) | 54 (7.84%) | |
| Current | 164 (23.80%) | 231 (33.53%) | 252 (36.57%) | |
| BMI (kg/m2) | 27.21 ± 3.69 | 28.64 ± 3.90 | 29.39 ± 3.59 | <0.001 |
| SBP (mmHg) | 140.05 ± 19.40 | 140.28 ± 20.60 | 139.42 ± 18.90 | 0.675 |
| DBP (mmHg) | 90.45 ± 13.85 | 91.84 ± 14.32 | 92.97 ± 13.74 | 0.002 |
| eGFR (mL/min/1.73 m2) | 94.05 ± 19.10 | 96.75 ± 21.67 | 97.26 ± 23.11 | 0.007 |
| TC (mmol/L) | 4.42 ± 1.34 | 4.56 ± 1.15 | 4.66 ± 1.04 | <0.001 |
| TG (mmol/L) | 1.14 ± 0.32 | 1.79 ± 0.43 | 3.22 ± 1.35 | <0.001 |
| HDL-C (mmol/L) | 1.32 ± 0.31 | 1.07 ± 0.21 | 0.93 ± 0.19 | <0.001 |
| LDL-C (mmol/L) | 2.59 ± 0.79 | 2.78 ± 0.80 | 2.58 ± 0.77 | <0.001 |
| FPG (mmol/L) | 5.06 ± 1.12 | 5.24 ± 1.22 | 5.55 ± 1.88 | <0.001 |
| AHI (events/h) | 16.20 (9.30-29.35) | 18.10 (10.30-34.15) | 20.80 (11.20-37.02) | <0.001 |
| Medication use, n (%) | ||||
| ACEIs/ARBs | 302 (43.83%) | 330 (47.90%) | 317 (46.01%) | 0.317 |
| β-Blockers | 126 (18.29%) | 123 (17.85%) | 137 (19.88%) | 0.595 |
| CCBs | 396 (57.47%) | 403 (58.49%) | 443 (64.30%) | 0.020 |
| Diuretics | 67 (9.72%) | 77 (11.18%) | 73 (10.60%) | 0.676 |
| Aspirins | 247 (35.85%) | 240 (34.83%) | 254 (36.87%) | 0.242 |
| Statins | 235 (34.11%) | 251 (36.43%) | 241 (34.99%) | 0.746 |
| Antidiabetic drugs | 53 (7.69%) | 87 (12.63%) | 116 (16.84%) | <0.001 |
| OSA therapy, n (%) | 0.305 | |||
| Untreated | 650 (94.34%) | 630 (91.44%) | 634 (92.02%) | |
| Regular oral appliance treatment | 18 (2.61%) | 29 (4.21%) | 26 (3.77%) | |
| Regular CPAP treatment | 21 (3.05%) | 30 (4.35%) | 29 (4.21%) |
Values of continuous variables are expressed as medians (twenty-fifth percentile–seventy-fifth percentile) or means (standard deviation). Categorical variables are expressed as n (%). BMI: body mass index; DBP: diastolic blood pressure; FPG: fasting plasma glucose; SBP: systolic blood pressure; HDL-C: high-density lipoprotein cholesterol; eGFR: estimated glomerular filtration rate; LDL-C: low-density lipoprotein cholesterol; TC: total cholesterol; AHI: apnea hypopnea index; TG: triglyceride; ACEIs: angiotensin-converting enzyme inhibitors; ARBs: angiotensin receptor blockers; CCBs: calcium channel blockers; CPAP: continuous positive airway pressure; OSA: obstructive sleep apnea; CMI: cardiometabolic index.
3.2. Association between CMI and Risk of CVD and Its Subtypes
During a median follow-up of 6.83 years (interquartile range: 5.92-8.00 years), 326 (14.19%) incident CVD were identified, including 121 (5.27%) incident stroke and 205 (8.92%) incident CHD. Furthermore, cumulative hazard curves of cardiovascular events across CMI tertiles are shown in Figure 2 (log-rank test: P < 0.001 for CVD and CHD, respectively; P = 0.084 for stroke).
Figure 2.

Cumulative hazards of risk of (a) cardiovascular disease, (b) coronary heart disease, and (c) stroke according to the tertile of the cardiometabolic index.
In total, there was a positive relation between CMI and the risk of new-onset CVD (Figure 3(a)), new-onset CHD (Figure 3(b)), and new-onset stroke (Figure 3(c)). As presented in Table 2, the HR (95% CI) for CVD in the fully adjusted regression model was 1.31 (1.20, 1.43) for per SD increase in CMI. Fully adjusted HRs (95% CIs) for CVD were 1.60 (1.18, 2.16) and 2.17 (1.63, 2.90) for subjects in tertile 2 and tertile 3, respectively. The risk of CVD increased substantially from quartile 1 to quartile 3 (P for trend < 0.001). Similarly, there was a meaningful association between CMI and CHD and stroke in the fully adjusted regression model (Table 2). For each SD increase in the CMI, the HR (95% CI) of the CHD rate was 1.33 (1.20, 1.48) in the fully adjusted regression model. The fully adjusted HR (95% CI) for CHD in tertile 3 was 2.62 (1.79, 3.83). The increased risk of CHD from tertile 1 to tertile 3 was statistically significant (P for trend < 0.001). Also, a remarkable positive association was shown between CMI and stroke (per SD increment; HR: 1.27; 95% CI: 1.10, 1.47). In the fully adjusted regression model, the HRs (95% CIs) for stroke were 1.23 (0.77, 1.98) and 1.64 (1.05, 2.57) for participants in tertile 2 and tertile 3, respectively, compared with participants in tertile 1 (P for trend = 0.029). In addition, the risk of new-onset CVD (HR: 1.68; 95% CI: 1.35, 2.09), CHD (HR: 1.81; 95% CI: 1.37, 2.39), and stroke (HR: 1.47; 95% CI: 1.02, 2.12) was significantly higher in fully adjusted regression models for participants in tertile 3 of CMI level (≥1.21) compared with those in tertile 1-2 (<1.21) (Table 2).
Figure 3.
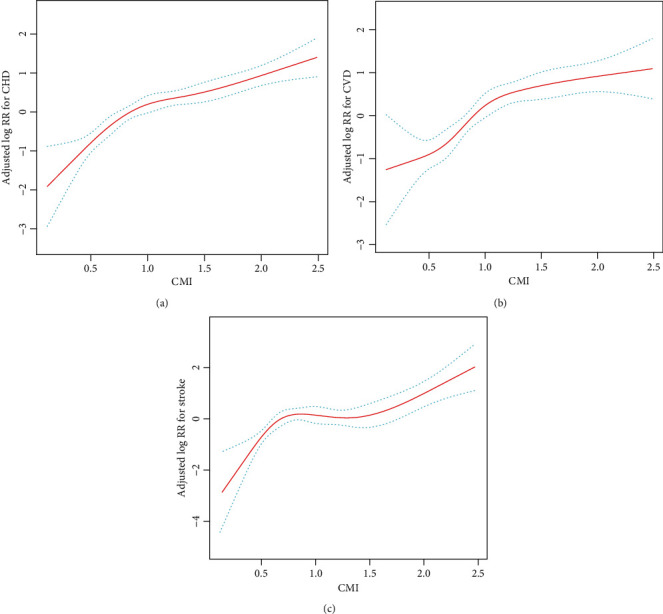
Smoothing curve revealing the effect of the cardiometabolic index on the risk of (a) cardiovascular disease, (b) coronary heart disease, and (c) stroke. ∗Adjusted for all noncollinear variables.
Table 2.
Hazard ratios (95% CI) of cardiovascular disease, coronary heart disease, and stroke, stratified by CMI.
| Exposure | Model 1 | Model 2 | Model 3 | |||
|---|---|---|---|---|---|---|
| (HR, 95% CI) | P value | (HR, 95% CI) | P value | (HR, 95% CI) | P value | |
| Cardiovascular disease | ||||||
| Per SD increment | 1.48 (1.33, 1.65) | <0.001 | 1.35 (1.24, 1.47) | <0.001 | 1.31 (1.20, 1.43) | <0.001 |
| Tertiles | ||||||
| T1 (<0.73) | Reference | Reference | Reference | |||
| T2 (≥0.73 to <1.21) | 1.86 (1.32, 2.63) | <0.001 | 1.70 (1.25, 2.31) | <0.001 | 1.60 (1.18, 2.16) | 0.003 |
| T3 (≥1.21) | 2.71 (1.87, 3.92) | <0.001 | 2.39 (1.78, 3.22) | <0.001 | 2.17 (1.63, 2.90) | <0.001 |
| P for trend | <0.001 | <0.001 | <0.001 | |||
| Categories | ||||||
| T1-2 (<1.21) | Reference | Reference | Reference | |||
| T3 (≥1.21) | 1.73 (1.33, 2.25) | <0.001 | 1.77 (1.42, 2.22) | <0.001 | 1.68 (1.35, 2.09) | <0.001 |
| Coronary heart disease | ||||||
| Per SD increment | 1.51 (1.32, 1.74) | <0.001 | 1.38 (1.24, 1.53) | <0.001 | 1.33 (1.20, 1.48) | <0.001 |
| Tertiles | ||||||
| T1 (<0.73) | Reference | Reference | Reference | |||
| T2 (≥0.73 to <1.21) | 2.25 (1.43, 3.54) | <0.001 | 2.06 (1.38, 3.08) | <0.001 | 1.90 (1.28, 2.83) | 0.002 |
| T3 (≥1.21) | 3.35 (2.07, 5.44) | <0.001 | 2.96 (2.01, 4.37) | <0.001 | 2.62 (1.79, 3.83) | <0.001 |
| P for trend | <0.001 | <0.001 | <0.001 | |||
| Categories | ||||||
| T1-2 (<1.21) | Reference | Reference | Reference | |||
| T3 (≥1.21) | 1.85 (1.32, 2.58) | <0.001 | 1.94 (1.46, 2.57) | <0.001 | 1.81 (1.37, 2.39) | <0.001 |
| Stroke | ||||||
| Per SD increment | 1.44 (1.20, 1.72) | <0.001 | 1.31 (1.13, 1.52) | <0.001 | 1.27 (1.10, 1.47) | 0.001 |
| Tertiles | ||||||
| T1 (<0.73) | Reference | Reference | Reference | |||
| T2 (≥0.73 to <1.21) | 1.48 (0.86, 2.55) | 0.156 | 1.30 (0.80, 2.09) | 0.285 | 1.23 (0.77, 1.98) | 0.384 |
| T3 (≥1.21) | 2.02 (1.13, 3.63) | 0.018 | 1.78 (1.12, 2.82) | 0.015 | 1.64 (1.05, 2.57) | 0.031 |
| P for trend | 0.017 | 0.013 | 0.029 | |||
| Categories | ||||||
| T1-2 (<1.21) | Reference | Reference | Reference | |||
| T3 (≥1.21) | 1.54 (1.02, 2.37) | 0.041 | 1.55 (1.07, 2.25) | 0.022 | 1.47 (1.02, 2.12) | 0.039 |
Model 1: adjusted for age and sex. Model 2: adjusted for variables in model 1 plus drinking status, history of diabetes, smoking status, DBP, SBP, and BMI. Model 3: adjusted for all noncollinear variables. SD: standard deviation; HR: hazard ratio; CI: confidence interval. Other abbreviations appear in Table 1.
3.3. Sensitivity Analysis
In sensitivity analyses, the association between CMI and the risk of CVD, CHD, and stroke did not change substantially after excluding participants who were regularly treated with CPAP (Supplemental Table 2), or after excluding participants who were current smokers and drinkers (Supplemental Table 3 and Supplemental Table 4), or after excluding participants who developed CVD within the first year of follow-up (Supplemental Table 5). In addition, a sensitivity analysis was performed using the Fine-Gray model to reduce the effect of competing mortality risks. The results of the competing risks model were similar to those of the Cox model (Supplemental Table 6).
3.4. Subgroup Analysis
We further performed a stratified analysis to assess the association of CMI (per SD increment) with risk of CVD (Figure 4(a)), risk of CHD (Figure 4(b)), and risk of stroke (Figure 4(c)). None of the variables, including age (<60 vs. ≥60 years), sex (female vs. male), SBP (<140 vs. ≥140 mmHg), BMI (<28 vs. ≥28 kg/m2), smoking (never vs. past vs. current), DBP (<90 vs. ≥90 mmHg), drinking (never vs. past vs. current), and AHI (≥ 30 vs. ≥ 15 to <30 vs. ≥ 5 to <15 events/h), were found to modify the association between CMI (per SD increment) and the risk of CVD (all P interactions > 0.05). Similar outcomes were observed for CHD and stroke.
Figure 4.

Association of the cardiometabolic index (per SD increment) with risk of (a) cardiovascular disease, (b) coronary heart disease, and (c) stroke in various subgroups. ∗Adjusted for all noncollinear variables, if not be stratified.
3.5. ROC Curve Analysis of Different Markers
The results of the ROC analysis for CMI and other predictors are shown in Table 3 and Supplementary Figure 1. Compared to TC, TG, HDL-C, TG/HDL-C, LDL-C, FPG, and WHtR, CMI was the strongest predictor of CVD (AUC = 0.617), with a sensitivity of 0.675, a specificity of 0.509, and the best threshold of 1.006 (Table 3). Similar outcomes were observed for CHD and stroke.
Table 3.
Receiver operating characteristic analysis for possible predictors for predicting cardiovascular disease, coronary heart disease, and stroke.
| Variables | AUC | Best threshold | Specificity | Sensitivity | PPV | NPV |
|---|---|---|---|---|---|---|
| Cardiovascular disease | ||||||
| CMI | 0.617 | 1.006 | 0.509 | 0.675 | 0.185 | 0.904 |
| TC | 0.520 | 4.965 | 0.707 | 0.344 | 0.163 | 0.867 |
| TG | 0.518 | 2.145 | 0.672 | 0.380 | 0.161 | 0.868 |
| HDL-C | 0.523 | 1.375 | 0.158 | 0.890 | 0.149 | 0.897 |
| TG/HDL-C | 0.521 | 2.613 | 0.768 | 0.291 | 0.172 | 0.868 |
| LDL-C | 0.538 | 2.525 | 0.478 | 0.617 | 0.163 | 0.883 |
| FPG | 0.508 | 5.095 | 0.582 | 0.470 | 0.156 | 0.870 |
| WHtR | 0.547 | 0.600 | 0.607 | 0.491 | 0.171 | 0.878 |
| Coronary heart disease | ||||||
| CMI | 0.630 | 1.006 | 0.504 | 0.732 | 0.126 | 0.950 |
| TC | 0.545 | 4.795 | 0.634 | 0.459 | 0.109 | 0.923 |
| TG | 0.539 | 1.805 | 0.531 | 0.556 | 0.104 | 0.924 |
| HDL-C | 0.537 | 1.245 | 0.269 | 0.800 | 0.097 | 0.932 |
| TG/HDL-C | 0.543 | 1.441 | 0.413 | 0.688 | 0.103 | 0.931 |
| LDL-C | 0.556 | 2.525 | 0.478 | 0.673 | 0.112 | 0.937 |
| FPG | 0.535 | 5.095 | 0.583 | 0.520 | 0.108 | 0.927 |
| WHtR | 0.538 | 0.617 | 0.696 | 0.400 | 0.114 | 0.922 |
| Stroke | ||||||
| CMI | 0.586 | 1.897 | 0.830 | 0.331 | 0.122 | 0.945 |
| TC | 0.524 | 4.645 | 0.444 | 0.653 | 0.078 | 0.947 |
| TG | 0.516 | 1.315 | 0.723 | 0.339 | 0.081 | 0.939 |
| HDL-C | 0.505 | 1.075 | 0.530 | 0.529 | 0.075 | 0.940 |
| TG/HDL-C | 0.517 | 1.466 | 0.586 | 0.512 | 0.081 | 0.944 |
| LDL-C | 0.500 | 1.845 | 0.158 | 0.909 | 0.072 | 0.961 |
| FPG | 0.539 | 4.975 | 0.500 | 0.605 | 0.080 | 0.946 |
| WHtR | 0.519 | 0.590 | 0.510 | 0.562 | 0.076 | 0.942 |
AUC: area under the receiver operating characteristic curve; NPV: negative predictive value; PPV: positive predictive value. Other abbreviations appear in Table 1.
3.6. Additive Effect of CMI to Established Risk Factors
The additional value of CMI for risk prediction of CVD, CHD, and stroke was evaluated based on discrimination (C-index), continuous NRI, and IDI (Table 4). The addition of CMI significantly improved the reclassification and discrimination for CVD prediction over the baseline risk model with a continuous NRI of 0.179 (0.114, 0.248) and an IDI of 0.013 (0.005, 0.025) (both P < 0.001). Similarly, the reclassification and discrimination for CHD and stroke prediction were also significantly improved with the addition of CMI. The C-index for predicting CVD, CHD, and stroke without CMI in the established risk factors were 0.600 (0.567, 0.633), 0.639 (0.602, 0.677), and 0.540 (0.484, 0.596), respectively. However, the addition of CMI to the established risk factors significantly improved the prediction of new-onset CVD, new-onset CHD and new-onset stroke with C-index of 0.648 (0.615, 0.681), 0.675 (0.638, 0.712), and 0.596 (0.541, 0.652), respectively.
Table 4.
Discrimination of each predictive model for outcomes using C-index, continuous-NRI, and IDI.
| C-index (95% CI) | P value | Continuous NRI (95% CI) | P value | IDI (95% CI) | P value | |
|---|---|---|---|---|---|---|
| Cardiovascular disease | ||||||
| Established risk factors | 0.600 (0.567, 0.633) | — | Reference | — | Reference | — |
| Established risk factors+CMI | 0.648 (0.615, 0.681) | <0.001 | 0.179 (0.114, 0.248) | <0.001 | 0.013 (0.005, 0.025) | <0.001 |
| Coronary heart disease | ||||||
| Established risk factors | 0.639 (0.602, 0.677) | — | Reference | — | Reference | — |
| Established risk factors+CMI | 0.675 (0.638, 0.712) | 0.001 | 0.173 (0.108, 0.257) | <0.001 | 0.008 (0.002, 0.018) | <0.001 |
| Stroke | ||||||
| Established risk factors | 0.540 (0.484, 0.596) | — | Reference | — | Reference | — |
| Established risk factors+CMI | 0.596 (0.541, 0.652) | 0.017 | 0.155 (0.020, 0.272) | 0.007 | 0.007 (0.001, 0.022) | <0.001 |
Established risk factors included age, sex, smoking status, drinking status, history of diabetes, BMI, TC, TG, HDL-C, LDL-C, and FPG levels. NRI: net reclassification index; IDI: integrated discrimination improvement. Other abbreviations appear in Table 1.
4. Discussion
Despite tremendous efforts to improve clinical outcomes in recent decades, CVD is still the leading cause of mortality and morbidity in China [41, 42]. The purpose of this study was to evaluate the relationship between CMI and the risk of CVD events. In this retrospective cohort study for the UROSAH study, we concluded that there was a significant association between CMI and the risk of CVD. Notably, the risk of CVD increased with increasing CMI during a median follow-up of 6.83 years. A similar pattern was found in CHD and stroke. After adjusting for possible confounders, the risk of CVD, CHD, and stroke was 2.17, 2.62, and 1.64 times higher in the group with the highest CMI level than in the lowest group. With each SD increase in CMI level, the risk of CVD increased by 31%, the risk of CHD increased by 33%, and the risk of stroke increased by 27%. These trends persisted when multiple sensitivity analyses and subgroup analyses were performed, indicating that the relationship is quite robust. Furthermore, prevention strategies that allow for early lifestyle interventions are a critical solution to reducing the burden of CVD [43]. Several guidelines recommend aggressive lifestyle interventions, such as limiting saturated fat intake, weight loss, and regular exercise, to lower CVD risk [44–46]. However, sustainable implementation of lifestyle interventions has long faced several challenges and cannot be overcome by a one-size-fits-all approach. Instead, sustainable implementation of lifestyle interventions requires, in particular, individualized lifestyle advice [47]. To be able to provide targeted lifestyle advice, it is paramount to adequately risk stratify individuals in preclinical status. In this study, the addition of CMI to a baseline risk model that includes traditional risk factors significantly enhances the ability to stratify risk. Our findings facilitate the identification of associations between CMI and CVD events in hypertensive patients with OSA and the screening of high-risk groups. In this way, medical professionals can develop appropriate prevention strategies for high-risk populations.
Obesity is a well-recognized risk factor for CVD [48]. However, several epidemiological surveys have revealed a protective effect of obesity on CVD outcomes classified by BMI and have questioned the nature of the relationship between obesity and CVD [49–51]. This paradox, also known as the “obesity paradox” or “BMI paradox,” suggests that BMI or other general measures of adiposity do not assess the actual metabolic status and body fat distribution [13, 52]. Compared to general adiposity, VAT may better reflect the state of natural metabolic impairment in obesity [13]. VAT is a complex, metabolically active tissue that produces different adipokines and hormones and leads to endocrine-metabolic comorbidities [53, 54]. It is also closely associated with increased adipocytokine production, proinflammatory activity, and disturbed lipid levels [51, 55, 56]. The accumulation of VAT determines cardiometabolic risk and cardiometabolic-related mortality, rather than the degree of obesity in general [12]. Currently, most measurements of VAT are performed by dual-energy X-ray absorptiometry, computed tomography, or magnetic resonance tomography. However, these imaging techniques are not appropriate for routine examinations because of their time expenditure, high cost, and radiation hazard [17, 18, 57].
CMI is a fresh index that was first proposed by Wakabayashi and Daimon in 2015 and was presumed to have significant advantages in the assessment of diabetes mellitus [26]. Subsequent studies further found that CMI could be an ideal marker for identifying VAT distribution and associated metabolic dysfunction and showed a close association with VAT measured with techniques such as magnetic resonance imaging [26, 58]. Several studies have shown that CMI is a useful screening tool for different populations, identifying those with worsening metabolic features and a higher risk of CVD, such as abnormal left ventricular geometry, arterial stiffness, hyperuricemia, diabetes, hypertension, and ischemic stroke [22, 24, 25, 59, 60]. One of the components of CMI, WHtR, is an alternative tool to BMI or WC to identify individuals at higher metabolic risk. WHtR has been reported to be a better discriminator of CHD and stroke risk than WC and BMI [61–63]. The TG/HDL-C ratio is likewise considered a decent indicator of CVD risk [64, 65]. The TG/HDL-C ratio has been shown to reflect small atherogenic LDL-C particles and is strongly associated with IR and metabolic syndrome [65–67]. Metabolic syndrome and IR are well-known markers of CVD risk, especially diabetes, hypertension, hyperlipidemia, and atherosclerosis [68, 69].
The mechanisms underlying the association between CMI and CVD and its subtypes are unclear. CMI is a surrogate marker for VAT and may primarily explain these associations. First, VAT has a high lipolytic activity, leading to an increase in circulating free fatty acids, which promotes endothelial dysfunction [70, 71]. Due to its anatomical location, VAT drains through the portal vein, which can lead to increased secretion of free fatty acids and proinflammatory cytokines in the liver, which further may promote increased secretion of IR and very-low-density lipoproteins [70–72]. Second, increased VAT leads to adipose dysfunction and induces chronic local inflammation [73, 74]. The classical features of the inflammatory process due to VAT are infiltration of M1 macrophages, production of reactive oxygen species, and release of proinflammatory cytokines [75]. The chronic inflammatory environment is associated with the development of type 2 diabetes, metabolic syndrome, dyslipidemia, and hypertension, all of which are associated with an increased risk of cardiovascular events [76–78]. The rapid expansion of VAT volume leads to cellular hypoxia activating hypoxia-inducible factor 1-alpha, increasing expression of interleukin 6 and leptin, reducing lipocalin production, and mediating macrophage attraction to adipose tissue [79–81]. Increased leakage of free fatty acids (FFA) from hypertrophic adipocytes has been reported due to enhanced basal lipolysis [1]. The released FFA promotes inflammation by binding to toll-like receptors 2 and 4, thereby activating the nuclear factor-kappa B and c-Jun N-terminal kinase signaling pathways [54, 82]. Activation of the above pathways increases the synthesis and secretion of proinflammatory cytokines, which mediate most of the complications associated with atherosclerosis. Third, VAT is associated with an increase in plasma plasminogen activator or inhibitor-1, which also contributes to thrombosis during atherosclerosis [70, 71]. Fourth, VAT is also associated with metabolic dysfunction and an increased risk of IR and hyperglycemia [83]. Several epidemiological studies have shown that IR and hyperinsulinemia are more important risk factors for cardiovascular disease than obesity per se [68, 84]. In terms of potential biological mechanisms, it has been proposed that high levels of cytokines and low levels of lipocalin may interfere with glucose homeostasis and contribute to chronic hyperinsulinemia and IR [85]. Additionally, the rate of lipolysis in VAT is higher than in subcutaneous adipose tissue, increasing the circulation of nonesterified fatty acids, which may affect hepatic insulin inactivation and contribute to IR and hyperinsulinemia [86]. In addition, IR decreases eNOS-active adipose tissue and NO production, which leads to plaque inflammation [85, 87]. These mechanisms sensitize plaque rupture, which leads to the development of CVD.
Our study has several strengths. According to a previous study in Japan, CMI may be the most effective predictor of CVD after adjusting for confounders [88]. However, because the participants in the previous study were a community healthy population, all participants in the present study were hypertensive patients with OSA. Therefore, a most important finding is that our study is the first cohort study to reveal the association of CMI with CVD, including stroke and CHD, in hypertensive patients with OSA. Second, the loss to follow-up was low and the high response rate of participants in this study compared to previous studies and adjustment for more potential confounders. Third, the analysis of effect modification factors for different subgroups in this study yields better data utilization and more robust conclusions. Finally, our results of the primary analyses were similar in several sensitivity analyses, which suggests that the results are robust to different assumptions. However, some limitations of this study should be acknowledged. First, since this was a retrospective study, we could not determine a causal relationship between CMI and the risk of CVD. For this reason, we performed sensitivity analyses after excluding participants who developed CVD within 1 year and found consistent results. Second, lifestyle, psychosocial factors, and ethnic factors are known confounders of CVD risk factors, and without these data, we were unable to assess these potential confounders. Third, the results may be biased because we did not consider antiplatelet and lipid-lowering therapy's type, intensity, and variability. However, we adjusted for the use of these agents. We will further optimize the study design, enhance the follow-up of the cohort, and collect more comprehensive information to make the findings more generalizable and convincing. Finally, the fact that these results are from a single center limits the generalizability of our results to other populations.
5. Conclusion
In conclusion, CMI is an independent predictor of CVD and its subtypes in patients with hypertension and OSA. As a clinically reliable and convenient marker of VAT, CMI has great potential use in predicting and preventing CVD.
Acknowledgments
This study was funded by the Chinese Academy of Medical Sciences (2020-RW330-002).
Data Availability
The data used to support the findings are available from the corresponding author upon request.
Conflicts of Interest
The authors deny any conflict of interest with this manuscript.
Authors' Contributions
Xintian Cai and Junli Hu contributed equally to this work.
Supplementary Materials
Supplementary Methods: details of polysomnography. Supplemental Table 1: collinearity diagnostics steps. Supplemental Table 2: hazard ratios (95% CI) for cardiovascular disease, coronary heart disease, and stroke were stratified by cardiometabolic index, excluding participants who were regularly receiving CPAP treatment. Supplemental Table 3: hazard ratios (95% CI) for cardiovascular disease, coronary heart disease, and stroke stratified by cardiometabolic index, excluding current smokers. Supplemental Table 4: hazard ratios (95% CI) for cardiovascular disease, coronary heart disease, and stroke stratified by cardiometabolic index, excluding current drinkers. Supplemental Table 5: hazard ratios (95% CI) for cardiovascular disease, coronary heart disease, and stroke were stratified by cardiometabolic index, excluding participants who developed cardiovascular disease within the first year of follow-up. Supplemental Table 6: competing risk models for the association of cardiometabolic index with cardiovascular disease, coronary heart disease, and stroke. Supplementary Figure 1: comparison of area under the receiver operating characteristic cures for predicting cardiovascular disease (A), coronary heart disease (B), and stroke (C).
References
- 1.Walli-Attaei M., Joseph P., Rosengren A., et al. Variations between women and men in risk factors, treatments, cardiovascular disease incidence, and death in 27 high-income, middle-income, and low-income countries (PURE): a prospective cohort study. Lancet . 2020;396(10244):97–109. doi: 10.1016/S0140-6736(20)30543-2. [DOI] [PubMed] [Google Scholar]
- 2.Liu S., Li Y., Zeng X., et al. Burden of cardiovascular diseases in China, 1990-2016: findings from the 2016 Global Burden of Disease Study. JAMA Cardiology . 2019;4(4):342–352. doi: 10.1001/jamacardio.2019.0295. [DOI] [PMC free article] [PubMed] [Google Scholar]
- 3.Yang L., Wu H., Jin X., et al. Study of cardiovascular disease prediction model based on random forest in eastern China. Scientific Reports . 2020;10(1):p. 5245. doi: 10.1038/s41598-020-62133-5. [DOI] [PMC free article] [PubMed] [Google Scholar]
- 4.McGrath B. P., Kundu P., Daya N., et al. Isolated diastolic hypertension in the UK biobank: comparison of ACC/AHA and ESC/NICE guideline definitions. Hypertension . 2020;76(3):699–706. doi: 10.1161/HYPERTENSIONAHA.120.15286. [DOI] [PMC free article] [PubMed] [Google Scholar]
- 5.Peker Y., Hedner J., Norum J., Kraiczi H., Carlson J. Increased incidence of cardiovascular disease in middle-aged men with obstructive sleep apnea. American Journal of Respiratory and Critical Care Medicine . 2002;166(2):159–165. doi: 10.1164/rccm.2105124. [DOI] [PubMed] [Google Scholar]
- 6.Dorkova Z., Petrasova D., Molcanyiova A., Popovnakova M., Tkacova R. Effects of continuous positive airway pressure on cardiovascular risk profile in patients with severe obstructive sleep apnea and metabolic syndrome. Chest . 2008;134(4):686–692. doi: 10.1378/chest.08-0556. [DOI] [PubMed] [Google Scholar]
- 7.Geovanini G. R., Wang R., Weng J., et al. Association between obstructive sleep apnea and cardiovascular risk factors: variation by age, sex, and race. The multi-ethnic study of atherosclerosis. Proceedings of the American Thoracic Society . 2018;15(8):970–977. doi: 10.1513/AnnalsATS.201802-121OC. [DOI] [PMC free article] [PubMed] [Google Scholar]
- 8.Brown J., Yazdi F., Jodari-Karimi M., Owen J. G., Reisin E. Obstructive sleep apnea and hypertension: updates to a critical relationship. Current Hypertension Reports . 2022:1–12. doi: 10.1007/s11906-022-01181-w. [DOI] [PMC free article] [PubMed] [Google Scholar]
- 9.Hoshide S., Kario K., Chia Y. C., et al. Characteristics of hypertension in obstructive sleep apnea: an Asian experience. Journal of Clinical Hypertension (Greenwich, Conn.) . 2021;23(3):489–495. doi: 10.1111/jch.14184. [DOI] [PMC free article] [PubMed] [Google Scholar]
- 10.Hanlon C. E., Binka E., Garofano J. S., Sterni L. M., Brady T. M. The association of obstructive sleep apnea and left ventricular hypertrophy in obese and overweight children with history of elevated blood pressure. Journal of Clinical Hypertension (Greenwich, Conn.) . 2019;21(7):984–990. doi: 10.1111/jch.13605. [DOI] [PMC free article] [PubMed] [Google Scholar]
- 11.Collen J., Lettieri C., Wickwire E., Holley A. Obstructive sleep apnea and cardiovascular disease, a story of confounders. Sleep & breathing = Schlaf & Atmung . 2020;24(4):1299–1313. doi: 10.1007/s11325-019-01945-w. [DOI] [PubMed] [Google Scholar]
- 12.Kammerlander A. A., Lyass A., Mahoney T. F., et al. Sex differences in the associations of visceral adipose tissue and cardiometabolic and cardiovascular disease risk: the Framingham Heart Study. Journal of the American Heart Association . 2021;10(11, article e019968) doi: 10.1161/JAHA.120.019968. [DOI] [PMC free article] [PubMed] [Google Scholar]
- 13.Huang Y., Liu Y., Ma Y., et al. Associations of visceral adipose tissue, circulating protein biomarkers, and risk of cardiovascular diseases: a Mendelian randomization analysis. Frontiers in Cell and Development Biology . 2022;10, article 840866 doi: 10.3389/fcell.2022.840866. [DOI] [PMC free article] [PubMed] [Google Scholar]
- 14.Terry J. G., Shay C. M., Schreiner P. J., et al. Intermuscular adipose tissue and subclinical coronary artery calcification in midlife: the CARDIA study (Coronary Artery Risk Development in Young Adults) Arteriosclerosis, Thrombosis, and Vascular Biology . 2017;37(12):2370–2378. doi: 10.1161/ATVBAHA.117.309633. [DOI] [PMC free article] [PubMed] [Google Scholar]
- 15.Lear S. A., Chockalingam A., Kohli S., Richardson C. G., Humphries K. H. Elevation in cardiovascular disease risk in south Asians is mediated by differences in visceral adipose tissue. Obesity . 2012;20(6):1293–1300. doi: 10.1038/oby.2011.395. [DOI] [PubMed] [Google Scholar]
- 16.Silveira E. A., Kliemann N., Noll M., Sarrafzadegan N., de Oliveira C. Visceral obesity and incident cancer and cardiovascular disease: an integrative review of the epidemiological evidence. Obesity Reviews : An Official Journal of the International Association for the Study of Obesity . 2021;22(1, article e13088) doi: 10.1111/obr.13088. [DOI] [PMC free article] [PubMed] [Google Scholar]
- 17.Yeoh A. J., Pedley A., Rosenquist K. J., Hoffmann U., Fox C. S. The association between subcutaneous fat density and the propensity to store fat viscerally. The Journal of Clinical Endocrinology and Metabolism . 2015;100(8):E1056–E1064. doi: 10.1210/jc.2014-4032. [DOI] [PMC free article] [PubMed] [Google Scholar]
- 18.Kuipers A. L., Zmuda J. M., Carr J. J., et al. Association of ectopic fat with abdominal aorto-illiac and coronary artery calcification in african ancestry men. Atherosclerosis . 2017;263:198–204. doi: 10.1016/j.atherosclerosis.2017.06.030. [DOI] [PMC free article] [PubMed] [Google Scholar]
- 19.Torriani M., Gill C. M., Daley S., Oliveira A. L., Azevedo D. C., Bredella M. A. Compartmental neck fat accumulation and its relation to cardiovascular risk and metabolic syndrome. The American Journal of Clinical Nutrition . 2014;100(5):1244–1251. doi: 10.3945/ajcn.114.088450. [DOI] [PMC free article] [PubMed] [Google Scholar]
- 20.Liu X., Wu Q., Yan G., et al. Cardiometabolic index: a new tool for screening the metabolically obese normal weight phenotype. Journal of Endocrinological Investigation . 2021;44(6):1253–1261. doi: 10.1007/s40618-020-01417-z. [DOI] [PubMed] [Google Scholar]
- 21.Li F. E., Luo Y., Zhang F. L., et al. Association between cardiometabolic index and stroke: a population- based cross-sectional study. Current Neurovascular Research . 2021;18(3):324–332. doi: 10.2174/1567202618666211013123557. [DOI] [PubMed] [Google Scholar]
- 22.Shi W. R., Wang H. Y., Chen S., Guo X. F., Li Z., Sun Y. X. Estimate of prevalent diabetes from cardiometabolic index in general Chinese population: a community-based study. Lipids in Health and Disease . 2018;17(1):p. 236. doi: 10.1186/s12944-018-0886-2. [DOI] [PMC free article] [PubMed] [Google Scholar]
- 23.Wang H., Sun Y., Li Z., et al. Gender-specific contribution of cardiometabolic index and lipid accumulation product to left ventricular geometry change in general population of rural China. BMC Cardiovascular Disorders . 2018;18(1):p. 62. doi: 10.1186/s12872-018-0798-0. [DOI] [PMC free article] [PubMed] [Google Scholar]
- 24.Wang H., Chen Y., Guo X., Chang Y., Sun Y. Usefulness of cardiometabolic index for the estimation of ischemic stroke risk among general population in rural China. Postgraduate Medicine . 2017;129(8):834–841. doi: 10.1080/00325481.2017.1375714. [DOI] [PubMed] [Google Scholar]
- 25.Datta Banik S., Pacheco-Pantoja E., Lugo R., et al. Evaluation of anthropometric indices and lipid parameters to predict metabolic syndrome among adults in Mexico. Diabetes, Metabolic Syndrome and Obesity . 2021;Volume 14:691–701. doi: 10.2147/DMSO.S281894. [DOI] [PMC free article] [PubMed] [Google Scholar]
- 26.Wakabayashi I., Daimon T. The "cardiometabolic index" as a new marker determined by adiposity and blood lipids for discrimination of diabetes mellitus. Clinica Chimica Acta . 2015;438:274–278. doi: 10.1016/j.cca.2014.08.042. [DOI] [PubMed] [Google Scholar]
- 27.Staynor J., Smith M. K., Donnelly C. J., Sallam A. E., Ackland T. R. DXA reference values and anthropometric screening for visceral obesity in Western Australian adults. Scientific Reports . 2020;10(1):p. 18731. doi: 10.1038/s41598-020-73631-x. [DOI] [PMC free article] [PubMed] [Google Scholar]
- 28.Yang J. Z., Dokpuang D., Nemati R., et al. Evaluation of ethnic variations in visceral, subcutaneous, intra-pancreatic, and intra-hepatic fat depositions by magnetic resonance imaging among New Zealanders. Biomedicine . 2020;8(6):p. 174. doi: 10.3390/biomedicines8060174. [DOI] [PMC free article] [PubMed] [Google Scholar]
- 29.Mzayek F., Wang L. E., Relyea G., et al. Impact of abdominal obesity on proximal and distal aorta wall thickness in African Americans: The Jackson Heart Study. Obesity . 2019;27(9):1527–1532. doi: 10.1002/oby.22563. [DOI] [PMC free article] [PubMed] [Google Scholar]
- 30.Uruska A., Zozulinska-Ziolkiewicz D., Niedzwiecki P., Pietrzak M., Wierusz-Wysocka B. TG/HDL-C ratio and visceral adiposity index may be useful in assessment of insulin resistance in adults with type 1 diabetes in clinical practice. Journal of Clinical Lipidology . 2018;12(3):734–740. doi: 10.1016/j.jacl.2018.01.005. [DOI] [PubMed] [Google Scholar]
- 31.Poon A. K., Meyer M. L., Tanaka H., et al. Association of insulin resistance, from mid-life to late-life, with aortic stiffness in late-life: the atherosclerosis risk in communities study. Cardiovascular Diabetology . 2020;19(1):p. 11. doi: 10.1186/s12933-020-0986-y. [DOI] [PMC free article] [PubMed] [Google Scholar]
- 32.Lin D., Qi Y., Huang C., et al. Associations of lipid parameters with insulin resistance and diabetes: a population-based study. Clinical Nutrition . 2018;37(4):1423–1429. doi: 10.1016/j.clnu.2017.06.018. [DOI] [PubMed] [Google Scholar]
- 33.Cai X., Li N., Hu J., et al. Nonlinear relationship between Chinese visceral adiposity index and new-onset myocardial infarction in patients with hypertension and obstructive sleep apnoea: insights from a cohort study. Journal of Inflammation Research . 2022;Volume 15:687–700. doi: 10.2147/JIR.S351238. [DOI] [PMC free article] [PubMed] [Google Scholar]
- 34.Xu P. H., Hui C., Lui M., Lam D., Fong D., Ip M. Incident type 2 diabetes in OSA and effect of CPAP treatment: a retrospective clinic cohort study. Chest . 2019;156(4):743–753. doi: 10.1016/j.chest.2019.04.130. [DOI] [PubMed] [Google Scholar]
- 35.Barnes M., Houston D., Worsnop C. J., et al. A randomized controlled trial of continuous positive airway pressure in mild obstructive sleep apnea. American Journal of Respiratory and Critical Care Medicine . 2002;165(6):773–780. doi: 10.1164/ajrccm.165.6.2003166. [DOI] [PubMed] [Google Scholar]
- 36.Kribbs N. B., Pack A. I., Kline L. R., et al. Objective measurement of patterns of nasal CPAP use by patients with obstructive sleep apnea. The American Review of Respiratory Disease . 1993;147(4):887–895. doi: 10.1164/ajrccm/147.4.887. [DOI] [PubMed] [Google Scholar]
- 37.Levey A. S., Inker L. A., Coresh J. GFR estimation: from physiology to public health. American Journal of Kidney Diseases: The Official Journal of the National Kidney Foundation . 2014;63(5):820–834. doi: 10.1053/j.ajkd.2013.12.006. [DOI] [PMC free article] [PubMed] [Google Scholar]
- 38.Cao Y., Zhu Q., Cai X., et al. Glial cell-derived neurotrophic factor functions as a potential candidate gene in obstructive sleep apnea based on a combination of bioinformatics and targeted capture sequencing analyses. BioMed Research International . 2021;2021 doi: 10.1155/2021/6656943.6656943 [DOI] [PMC free article] [PubMed] [Google Scholar]
- 39.Li N., Cai X., Zhu Q., et al. Association between plasma homocysteine concentrations and the first ischemic stroke in hypertensive patients with obstructive sleep apnea: a 7-year retrospective cohort study from China. Disease Markers . 2021;2021 doi: 10.1155/2021/9953858.9953858 [DOI] [PMC free article] [PubMed] [Google Scholar]
- 40.Li N., Heizhati M., Sun C., et al. Thyroid stimulating hormone is increased in hypertensive patients with obstructive sleep apnea. International Journal of Endocrinology . 2016;2016 doi: 10.1155/2016/4802720. [DOI] [PMC free article] [PubMed] [Google Scholar]
- 41.Xia S., Du X., Guo L., et al. Sex differences in primary and secondary prevention of cardiovascular disease in China. Circulation . 2020;141(7):530–539. doi: 10.1161/CIRCULATIONAHA.119.043731. [DOI] [PubMed] [Google Scholar]
- 42.Zhao D., Liu J., Wang M., Zhang X., Zhou M. Epidemiology of cardiovascular disease in China: current features and implications. Nature Reviews. Cardiology . 2019;16(4):203–212. doi: 10.1038/s41569-018-0119-4. [DOI] [PubMed] [Google Scholar]
- 43.Liu G., Li Y., Hu Y., et al. Influence of lifestyle on incident cardiovascular disease and mortality in patients with diabetes mellitus. Journal of the American College of Cardiology . 2018;71(25):2867–2876. doi: 10.1016/j.jacc.2018.04.027. [DOI] [PMC free article] [PubMed] [Google Scholar]
- 44.Han H., Cao Y., Feng C., et al. Association of a healthy lifestyle with all-cause and cause-specific mortality among Individuals with type 2 diabetes: a prospective study in UK Biobank. Diabetes Care . 2022;45(2):319–329. doi: 10.2337/dc21-1512. [DOI] [PubMed] [Google Scholar]
- 45.Wei X., Zhang Z., Chong M., et al. Evaluation of a package of risk-based pharmaceutical and lifestyle interventions in patients with hypertension and/or diabetes in rural China: a pragmatic cluster randomised controlled trial. PLoS Medicine . 2021;18(7, article e1003694) doi: 10.1371/journal.pmed.1003694. [DOI] [PMC free article] [PubMed] [Google Scholar]
- 46.Fernández-García J. C., Martínez-Sánchez M. A., Bernal-López M. R., et al. Effect of a lifestyle intervention program with energy-restricted Mediterranean diet and exercise on the serum polyamine metabolome in individuals at high cardiovascular disease risk: a randomized clinical trial. The American Journal of Clinical Nutrition . 2020;111(5):975–982. doi: 10.1093/ajcn/nqaa064. [DOI] [PubMed] [Google Scholar]
- 47.Magkos F., Hjorth M. F., Astrup A. Diet and exercise in the prevention and treatment of type 2 diabetes mellitus. Nature Reviews. Endocrinology . 2020;16(10):545–555. doi: 10.1038/s41574-020-0381-5. [DOI] [PubMed] [Google Scholar]
- 48.Powell-Wiley T. M., Poirier P., Burke L. E., et al. Obesity and cardiovascular disease: a scientific statement from the American Heart Association. Circulation . 2021;143(21):e984–e1010. doi: 10.1161/CIR.0000000000000973. [DOI] [PMC free article] [PubMed] [Google Scholar]
- 49.Polemiti E., Baudry J., Kuxhaus O., et al. BMI and BMI change following incident type 2 diabetes and risk of microvascular and macrovascular complications: the EPIC-Potsdam study. Diabetologia . 2021;64(4):814–825. doi: 10.1007/s00125-020-05362-7. [DOI] [PMC free article] [PubMed] [Google Scholar]
- 50.Iliodromiti S., Celis-Morales C. A., Lyall D. M., et al. The impact of confounding on the associations of different adiposity measures with the incidence of cardiovascular disease: a cohort study of 296 535 adults of white European descent. European Heart Journal . 2018;39(17):1514–1520. doi: 10.1093/eurheartj/ehy057. [DOI] [PMC free article] [PubMed] [Google Scholar]
- 51.Elagizi A., Kachur S., Lavie C. J., et al. An overview and update on obesity and the obesity paradox in cardiovascular diseases. Progress in Cardiovascular Diseases . 2018;61(2):142–150. doi: 10.1016/j.pcad.2018.07.003. [DOI] [PubMed] [Google Scholar]
- 52.Akoumianakis I., Antoniades C. The interplay between adipose tissue and the cardiovascular system: is fat always bad. Cardiovascular Research . 2017;113(9):999–1008. doi: 10.1093/cvr/cvx111. [DOI] [PubMed] [Google Scholar]
- 53.Tchernof A., Després J. P. Pathophysiology of human visceral obesity: an update. Physiological Reviews . 2013;93(1):359–404. doi: 10.1152/physrev.00033.2011. [DOI] [PubMed] [Google Scholar]
- 54.Aparecida Silveira E., Vaseghi G., de Carvalho Santos A. S., et al. Visceral obesity and its shared role in cancer and cardiovascular disease: a scoping review of the pathophysiology and pharmacological treatments. International Journal of Molecular Sciences . 2020;21(23):p. 9042. doi: 10.3390/ijms21239042. [DOI] [PMC free article] [PubMed] [Google Scholar]
- 55.Agbim U., Carr R. M., Pickett-Blakely O., Dagogo-Jack S. Ethnic disparities in adiposity: focus on non-alcoholic fatty liver disease, visceral, and generalized obesity. Current Obesity Reports . 2019;8(3):243–254. doi: 10.1007/s13679-019-00349-x. [DOI] [PMC free article] [PubMed] [Google Scholar]
- 56.Wensveen F. M., Valentić S., Šestan M., Turk Wensveen T., Polić B. The “Big Bang” in obese fat: events initiating obesity-induced adipose tissue inflammation. European Journal of Immunology . 2015;45(9):2446–2456. doi: 10.1002/eji.201545502. [DOI] [PubMed] [Google Scholar]
- 57.So R., Sasai H., Matsuo T., et al. Visceral adipose tissue volume estimated at imaging sites 5-6 cm above L4-L5 is optimal for predicting cardiovascular risk factors in obese Japanese men. The Tohoku Journal of Experimental Medicine . 2012;227(4):297–305. doi: 10.1620/tjem.227.297. [DOI] [PubMed] [Google Scholar]
- 58.Zuo Y. Q., Gao Z. H., Yin Y. L., Yang X., Feng P. Y. Association between the cardiometabolic index and hyperuricemia in an asymptomatic population with normal body mass index. International Journal of General Medicine . 2021;Volume 14:8603–8610. doi: 10.2147/IJGM.S340595. [DOI] [PMC free article] [PubMed] [Google Scholar]
- 59.Shao M. J., Luo J. Y., Shi J., et al. Association of visceral obesity-related Indices with coronary collateralization in patients with chronic total occlusion. Frontiers in Cardiovascular Medicine . 2021;8, article 742855 doi: 10.3389/fcvm.2021.742855. [DOI] [PMC free article] [PubMed] [Google Scholar]
- 60.Zou J., Xiong H., Zhang H., Hu C., Lu S., Zou Y. Association between the cardiometabolic index and non-alcoholic fatty liver disease: insights from a general population. BMC Gastroenterology . 2022;22(1):p. 20. doi: 10.1186/s12876-022-02099-y. [DOI] [PMC free article] [PubMed] [Google Scholar]
- 61.Gelber R. P., Gaziano J. M., Orav E. J., Manson J. E., Buring J. E., Kurth T. Measures of obesity and cardiovascular risk among men and women. Journal of the American College of Cardiology . 2008;52(8):605–615. doi: 10.1016/j.jacc.2008.03.066. [DOI] [PMC free article] [PubMed] [Google Scholar]
- 62.Mohammadreza B., Farzad H., Davoud K., Fereidoun A. Prognostic significance of the complex "Visceral Adiposity Index" vs. simple anthropometric measures: Tehran lipid and glucose study. Cardiovascular Diabetology . 2012;11(1):p. 20. doi: 10.1186/1475-2840-11-20. [DOI] [PMC free article] [PubMed] [Google Scholar]
- 63.Ashwell M., Gunn P., Gibson S. Waist-to-height ratio is a better screening tool than waist circumference and BMI for adult cardiometabolic risk factors: systematic review and meta- analysis. Obesity Reviews : An Official Journal of the International Association for the Study of Obesity . 2012;13(3):275–286. doi: 10.1111/j.1467-789X.2011.00952.x. [DOI] [PubMed] [Google Scholar]
- 64.Salazar M. R., Carbajal H. A., Espeche W. G., et al. Identifying cardiovascular disease risk and outcome: use of the plasma triglyceride/high-density lipoprotein cholesterol concentration ratio versus metabolic syndrome criteria. Journal of Internal Medicine . 2013;273(6):595–601. doi: 10.1111/joim.12036. [DOI] [PubMed] [Google Scholar]
- 65.Mirshafiei H., Darroudi S., Ghayour-Mobarhan M., et al. Altered triglyceride glucose index and fasted serum triglyceride high-density lipoprotein cholesterol ratio predict incidence of cardiovascular disease in the Mashhad cohort study. BioFactors . 2022;48(3):643–650. doi: 10.1002/biof.1816. [DOI] [PubMed] [Google Scholar]
- 66.Rasouli N., Younes N., Utzschneider K. M., et al. Association of baseline characteristics with insulin sensitivity and β-cell function in the glycemia reduction approaches in diabetes: a comparative effectiveness (GRADE) study cohort. Diabetes Care . 2021;44(2):340–349. doi: 10.2337/dc20-1787. [DOI] [PMC free article] [PubMed] [Google Scholar]
- 67.Kim J., Shin S. J., Kim Y. S., Kang H. T. Positive association between the ratio of triglycerides to high-density lipoprotein cholesterol and diabetes incidence in Korean adults. Cardiovascular Diabetology . 2021;20(1):p. 183. doi: 10.1186/s12933-021-01377-5. [DOI] [PMC free article] [PubMed] [Google Scholar]
- 68.Hill M. A., Yang Y., Zhang L., et al. Insulin resistance, cardiovascular stiffening and cardiovascular disease. Metabolism . 2021;119, article 154766 doi: 10.1016/j.metabol.2021.154766. [DOI] [PubMed] [Google Scholar]
- 69.Muzurović E., Mikhailidis D. P., Mantzoros C. Non-alcoholic fatty liver disease, insulin resistance, metabolic syndrome and their association with vascular risk. Metabolism . 2021;119, article 154770 doi: 10.1016/j.metabol.2021.154770. [DOI] [PubMed] [Google Scholar]
- 70.Ibrahim M. M. Subcutaneous and visceral adipose tissue: structural and functional differences. Obesity Reviews : An Official Journal of the International Association for the Study of Obesity . 2010;11(1):11–18. doi: 10.1111/j.1467-789X.2009.00623.x. [DOI] [PubMed] [Google Scholar]
- 71.Wajchenberg B. L. Subcutaneous and visceral adipose tissue: their relation to the metabolic syndrome. Endocrine Reviews . 2000;21(6):697–738. doi: 10.1210/edrv.21.6.0415. [DOI] [PubMed] [Google Scholar]
- 72.Ballin M., Nordström P., Niklasson J., Nordström A. Associations of visceral adipose tissue and skeletal muscle density with incident stroke, myocardial infarction, and all-cause mortality in community-dwelling 70-year-old individuals: a prospective cohort study. Journal of the American Heart Association . 2021;10(9, article e020065) doi: 10.1161/JAHA.120.020065. [DOI] [PMC free article] [PubMed] [Google Scholar]
- 73.Macdougall C. E., Wood E. G., Loschko J., et al. Visceral adipose tissue immune homeostasis is regulated by the crosstalk between adipocytes and dendritic cell subsets. Cell Metabolism . 2018;27(3):588–601.e4. doi: 10.1016/j.cmet.2018.02.007. [DOI] [PMC free article] [PubMed] [Google Scholar]
- 74.Ormazabal P., Scazzocchio B., Varì R., et al. Effect of protocatechuic acid on insulin responsiveness and inflammation in visceral adipose tissue from obese individuals: possible role for PTP1B. International Journal of Obesity . 2018;42(12):2012–2021. doi: 10.1038/s41366-018-0075-4. [DOI] [PubMed] [Google Scholar]
- 75.Lumeng C. N., Bodzin J. L., Saltiel A. R. Obesity induces a phenotypic switch in adipose tissue macrophage polarization. The Journal of Clinical Investigation . 2007;117(1):175–184. doi: 10.1172/JCI29881. [DOI] [PMC free article] [PubMed] [Google Scholar]
- 76.Saltiel A. R., Olefsky J. M. Inflammatory mechanisms linking obesity and metabolic disease. The Journal of Clinical Investigation . 2017;127(1):1–4. doi: 10.1172/JCI92035. [DOI] [PMC free article] [PubMed] [Google Scholar]
- 77.Prattichizzo F., De Nigris V., Spiga R., et al. Inflammageing and metaflammation: the yin and yang of type 2 diabetes. Ageing Research Reviews . 2018;41:1–17. doi: 10.1016/j.arr.2017.10.003. [DOI] [PubMed] [Google Scholar]
- 78.Mouton A. J., Li X., Hall M. E., Hall J. E. Obesity, hypertension, and cardiac dysfunction: novel roles of immunometabolism in macrophage activation and inflammation. Circulation Research . 2020;126(6):789–806. doi: 10.1161/CIRCRESAHA.119.312321. [DOI] [PMC free article] [PubMed] [Google Scholar]
- 79.Longo M., Zatterale F., Naderi J., et al. Adipose tissue dysfunction as determinant of obesity-associated metabolic complications. International Journal of Molecular Sciences . 2019;20(9):p. 2358. doi: 10.3390/ijms20092358. [DOI] [PMC free article] [PubMed] [Google Scholar]
- 80.Chen B., Lam K. S., Wang Y., et al. Hypoxia dysregulates the production of adiponectin and plasminogen activator inhibitor-1 independent of reactive oxygen species in adipocytes. Biochemical and Biophysical Research Communications . 2006;341(2):549–556. doi: 10.1016/j.bbrc.2006.01.004. [DOI] [PubMed] [Google Scholar]
- 81.Cancello R., Henegar C., Viguerie N., et al. Reduction of macrophage infiltration and chemoattractant gene expression changes in white adipose tissue of morbidly obese subjects after surgery-induced weight loss. Diabetes . 2005;54(8):2277–2286. doi: 10.2337/diabetes.54.8.2277. [DOI] [PubMed] [Google Scholar]
- 82.Castoldi A., Naffah de Souza C., Câmara N. O., Moraes-Vieira P. M. The macrophage switch in obesity development. Frontiers in Immunology . 2016;6:p. 637. doi: 10.3389/fimmu.2015.00637. [DOI] [PMC free article] [PubMed] [Google Scholar]
- 83.Cao E., Watt M. J., Nowell C. J., et al. Mesenteric lymphatic dysfunction promotes insulin resistance and represents a potential treatment target in obesity. Nature Metabolism . 2021;3(9):1175–1188. doi: 10.1038/s42255-021-00457-w. [DOI] [PubMed] [Google Scholar]
- 84.Mongraw-Chaffin M., Foster M. C., Anderson C., et al. Metabolically healthy obesity, transition to metabolic syndrome, and cardiovascular risk. Journal of the American College of Cardiology . 2018;71(17):1857–1865. doi: 10.1016/j.jacc.2018.02.055. [DOI] [PMC free article] [PubMed] [Google Scholar]
- 85.Greenberg A. S., McDaniel M. L. Identifying the links between obesity, insulin resistance and beta-cell function: potential role of adipocyte-derived cytokines in the pathogenesis of type 2 diabetes. European Journal of Clinical Investigation . 2002;32(Suppl 3):24–34. doi: 10.1046/j.1365-2362.32.s3.4.x. [DOI] [PubMed] [Google Scholar]
- 86.Frayn K. N. Visceral fat and insulin resistance--causative or correlative. The British Journal of Nutrition . 2000;83(Suppl 1):S71–S77. doi: 10.1017/S0007114500000982. [DOI] [PubMed] [Google Scholar]
- 87.Paneni F., Costantino S., Cosentino F. Insulin resistance, diabetes, and cardiovascular risk. Current Atherosclerosis Reports . 2014;16(7):p. 419. doi: 10.1007/s11883-014-0419-z. [DOI] [PubMed] [Google Scholar]
- 88.Higashiyama A., Wakabayashi I., Okamura T., et al. The risk of fasting triglycerides and its related indices for ischemic cardiovascular diseases in Japanese community dwellers: the Suita study. Journal of Atherosclerosis and Thrombosis . 2021;28(12):1275–1288. doi: 10.5551/jat.62730. [DOI] [PMC free article] [PubMed] [Google Scholar]
Associated Data
This section collects any data citations, data availability statements, or supplementary materials included in this article.
Supplementary Materials
Supplementary Methods: details of polysomnography. Supplemental Table 1: collinearity diagnostics steps. Supplemental Table 2: hazard ratios (95% CI) for cardiovascular disease, coronary heart disease, and stroke were stratified by cardiometabolic index, excluding participants who were regularly receiving CPAP treatment. Supplemental Table 3: hazard ratios (95% CI) for cardiovascular disease, coronary heart disease, and stroke stratified by cardiometabolic index, excluding current smokers. Supplemental Table 4: hazard ratios (95% CI) for cardiovascular disease, coronary heart disease, and stroke stratified by cardiometabolic index, excluding current drinkers. Supplemental Table 5: hazard ratios (95% CI) for cardiovascular disease, coronary heart disease, and stroke were stratified by cardiometabolic index, excluding participants who developed cardiovascular disease within the first year of follow-up. Supplemental Table 6: competing risk models for the association of cardiometabolic index with cardiovascular disease, coronary heart disease, and stroke. Supplementary Figure 1: comparison of area under the receiver operating characteristic cures for predicting cardiovascular disease (A), coronary heart disease (B), and stroke (C).
Data Availability Statement
The data used to support the findings are available from the corresponding author upon request.