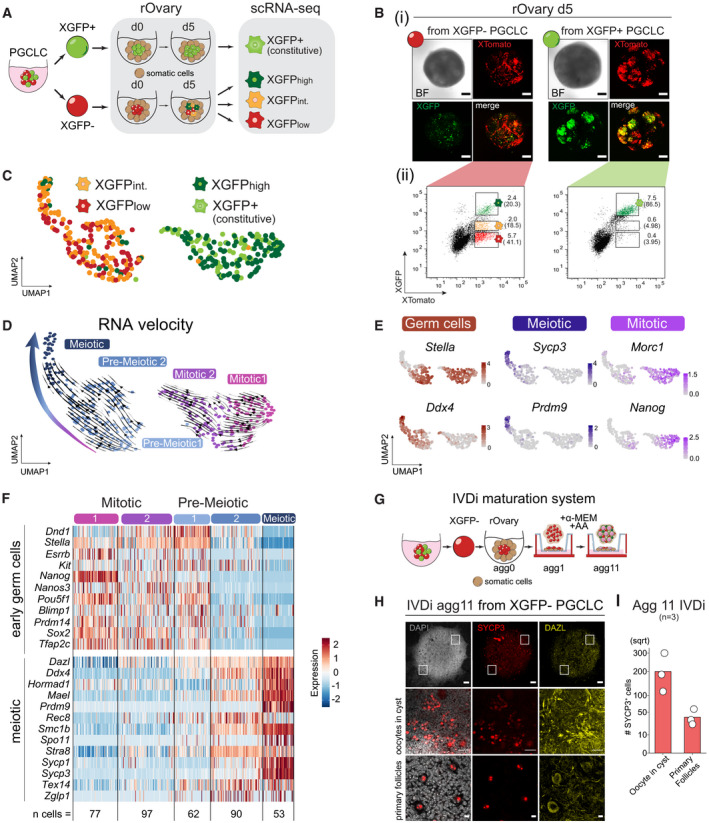
Schematic illustration of the single‐cell RNA‐seq experiment and the isolated populations during germ cell maturation in rOvaries. The first 24h of culture are indicated as d0. rOvary, reconstituted Ovary; d, day of rOvary culture; XGFPint., XGFPintermediate.
(i) Imaging of XGFP and XTomato reporters in rOvaries d5 aggregated with E13.5 gonadal and mesonephric cells. Scale bars = 50μm. BF, bright field. (ii) FACS gating strategy for single cells sorted XTomato+ cells against XGFP intensities. Numbers indicate the percentage of gated live cells over the total population. Numbers in brackets indicate the percentage of gated cells over the XTomato+ population.
UMAP projection labelled with FACS sorted populations. XGFPint., XGFPintermediate.
UMAP embedding based on shared nearest‐neighbour (SNN) modularity clustering identified five clusters, termed Mitotic 1 (n = 77), Mitotic 2 (n = 97), Pre‐meiotic 1 (n = 62), Pre‐meiotic 2 (n = 90) and Meiotic (n = 53) labelled with different colours. Arrows indicating cell trajectories, inferred by RNA velocity analysis.
Marker gene expression projected onto the UMAP plot.
Heatmap of gene expression dynamics throughout germ cell maturation clusters. Selected genes belong to the category “early germ cell” and “meiotic.” Z‐score is shown.
Schematic representation of the IVDi (in vitro differentiation) maturation system. The stages of oogenesis in culture for 11 days are indicated. The condition of culture is indicated above. rOvary, reconstituted Ovary; Agg, aggregation day; AA, Ascorbic Acid.
Immunofluorescence images of SYCP3 (red), DAZL (yellow) and DAPI at agg11 of IVDi tissue maturation from XGFP− PGCLCs. IVDi, in vitro differentiation. White squares indicate the positions of the magnified section shown below. Top panel scale bar = 100 μm. Middle panel scale bar = 10 μm. Bottom panel scale bar = 50 μm.
Quantification of SYCP3+ cells (oocytes in cyst and primary follicles) in IVDi tissues at agg11. Each dot represents one IVDi tissue performed in three biological replicates.