


Figure 2.
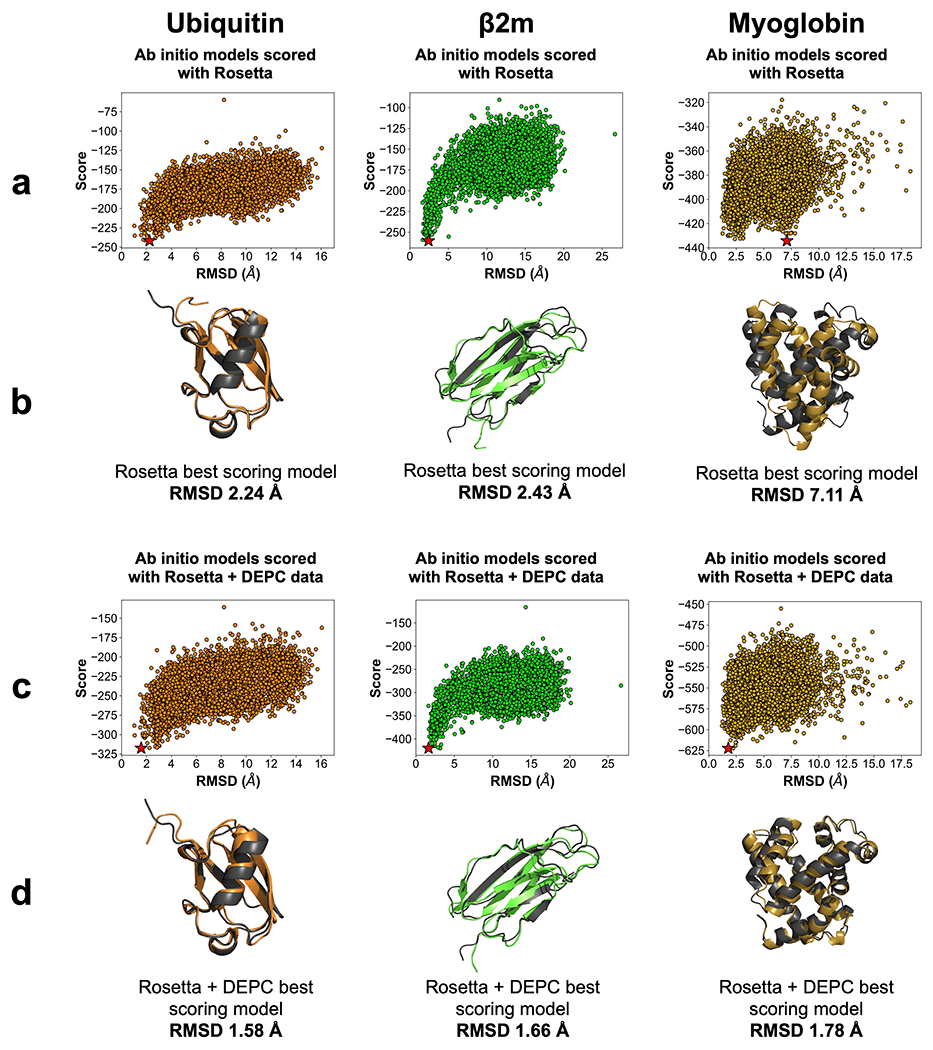
(a) Rosetta score versus RMSD plots for 10,000 ab initio models of ubiquitin (orange), β2m (lime), and myoglobin (gold). Best scoring models are denoted by a star (★). (b) Best scoring Rosetta model (color) aligned with respective crystal structure (dark grey). RMSD is listed below the alignments. (c) Rosetta and DEPC score versus RMSD plots for benchmark protein model sets. Best scoring models are denoted by a star (★). (d) Best scoring Rosetta and DEPC model (color) aligned with respective crystal structure (dark grey). RMSD is listed below the alignments.