


Figure 3. A fraction of randomly growing HER2-luminal cells occupies a pre-DTP state characterized by a G0-like signature.
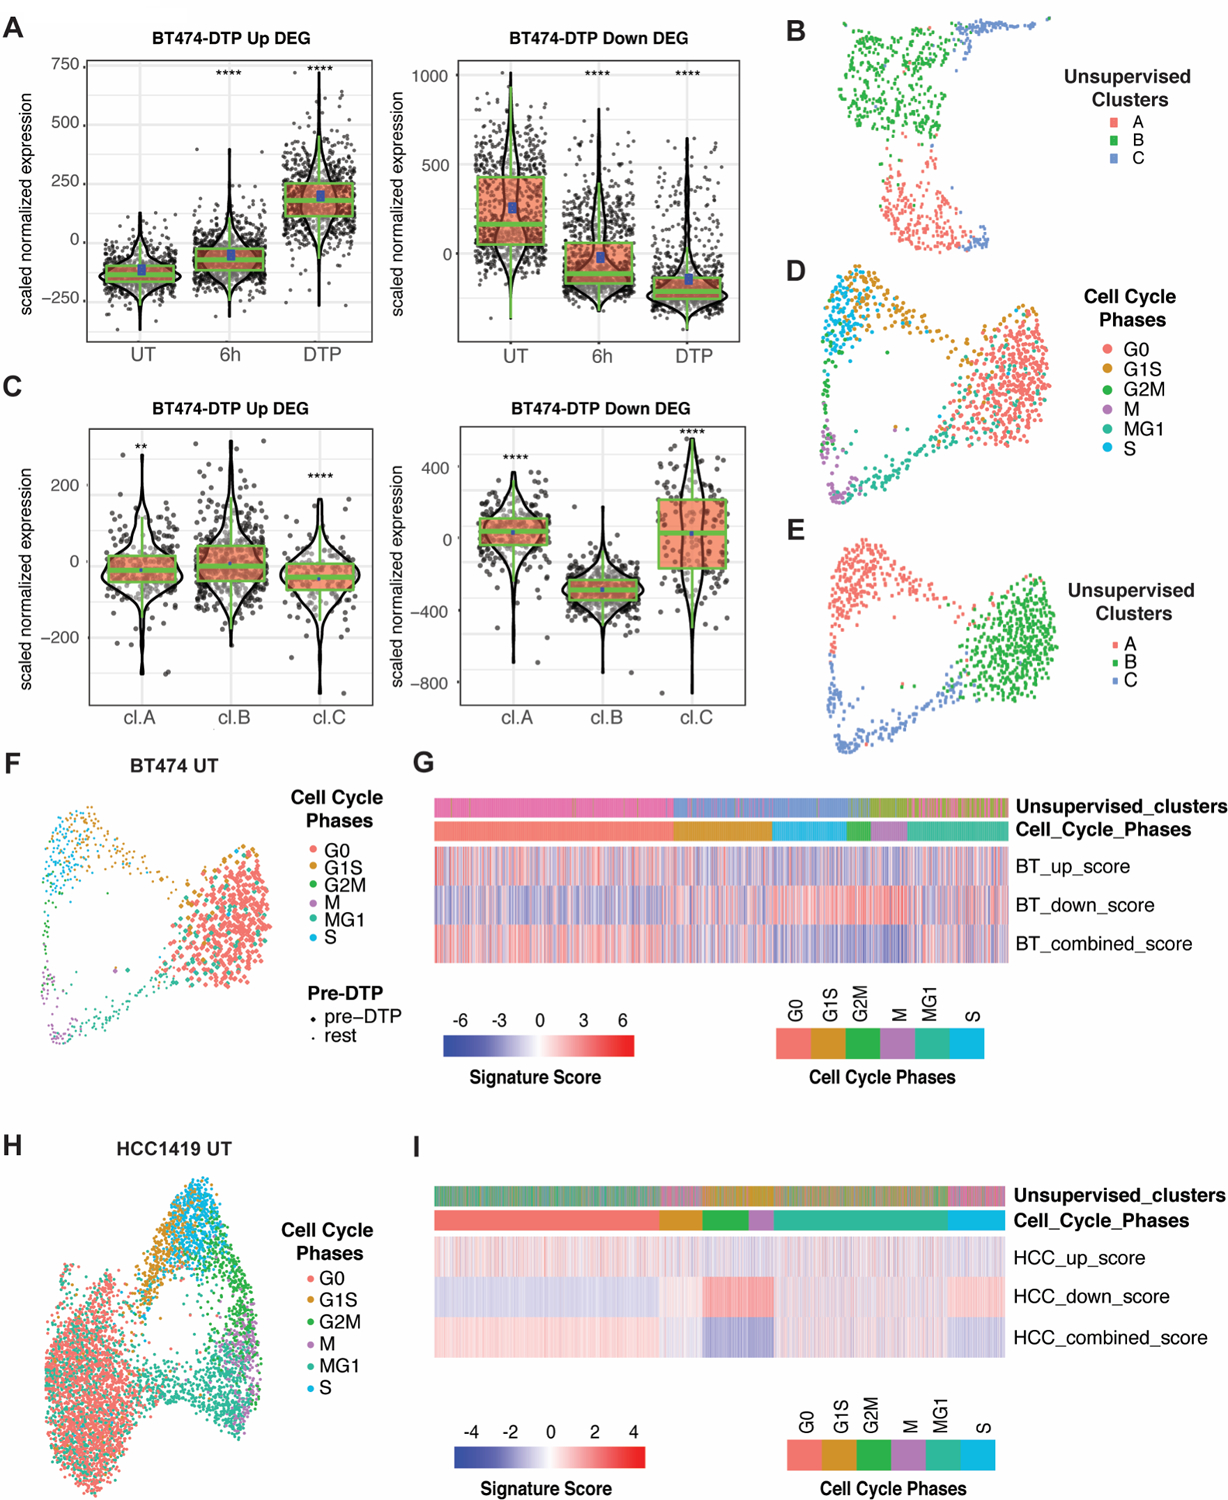
A, Aggregate expression of BT474 lapatinib-DTP Up and Down DEGs in single cells from untreated (UT), 6-hour lapatinib-treated (6h) and DTP (14-day lapatinib) samples. ****P<0.0001, unpaired t-test compared to UT. B, UMAP projection of scRNA-Seq of untreated BT474 cells. Cells are colored by their unsupervised clusters. C, Aggregate expression of BT474 lapatinib-DTP Up and Down DEGs, as indicated, in each unsupervised cluster of untreated BT474 cells from B. **P<0.01, ****P<0.0001, unpaired t-test compared to cluster B. D, UMAP projection of untreated BT474 cells using cell cycle signature genes as defined by Xue et al. (44) with cells colored by cell cycle stage (see Methods for details). E, UMAP projection showing untreated BT474 cells clustered by cell cycle genes as in D, but with cells colored according to their unsupervised clusters (as determined in B). F, Same projection as in D, but with pre-DTPs (based on their BT474-DTP combined DEG score) shown as larger circles compared with other cells. G, Heatmap displaying BT474-DTP Up DEG score, BT474-DTP Down DEG score and BT474-DTP combined DEG score (up DEG score minus down DEG score), in each untreated BT474 cells. The upper panels show the unsupervised clusters from B and their cell cycle phase, determined by expression of the cell cycle genes of Xue et al. (44). H, UMAP projection of supervised clustering of untreated HCC1419 cells by their cell cycle genes. Cells are colored by cell cycle status. I, Heatmap displaying HCC1419-DTP Up DEG score, HCC1419-DTP Down DEG score, and HCC1419-DTP combined DEG score (up minus down DEG score) in single cells from HCC1419. Upper panels display the unsupervised cluster to which each untreated HCC1419 cell belongs and its inferred cell cycle phase.