


Figure 5.
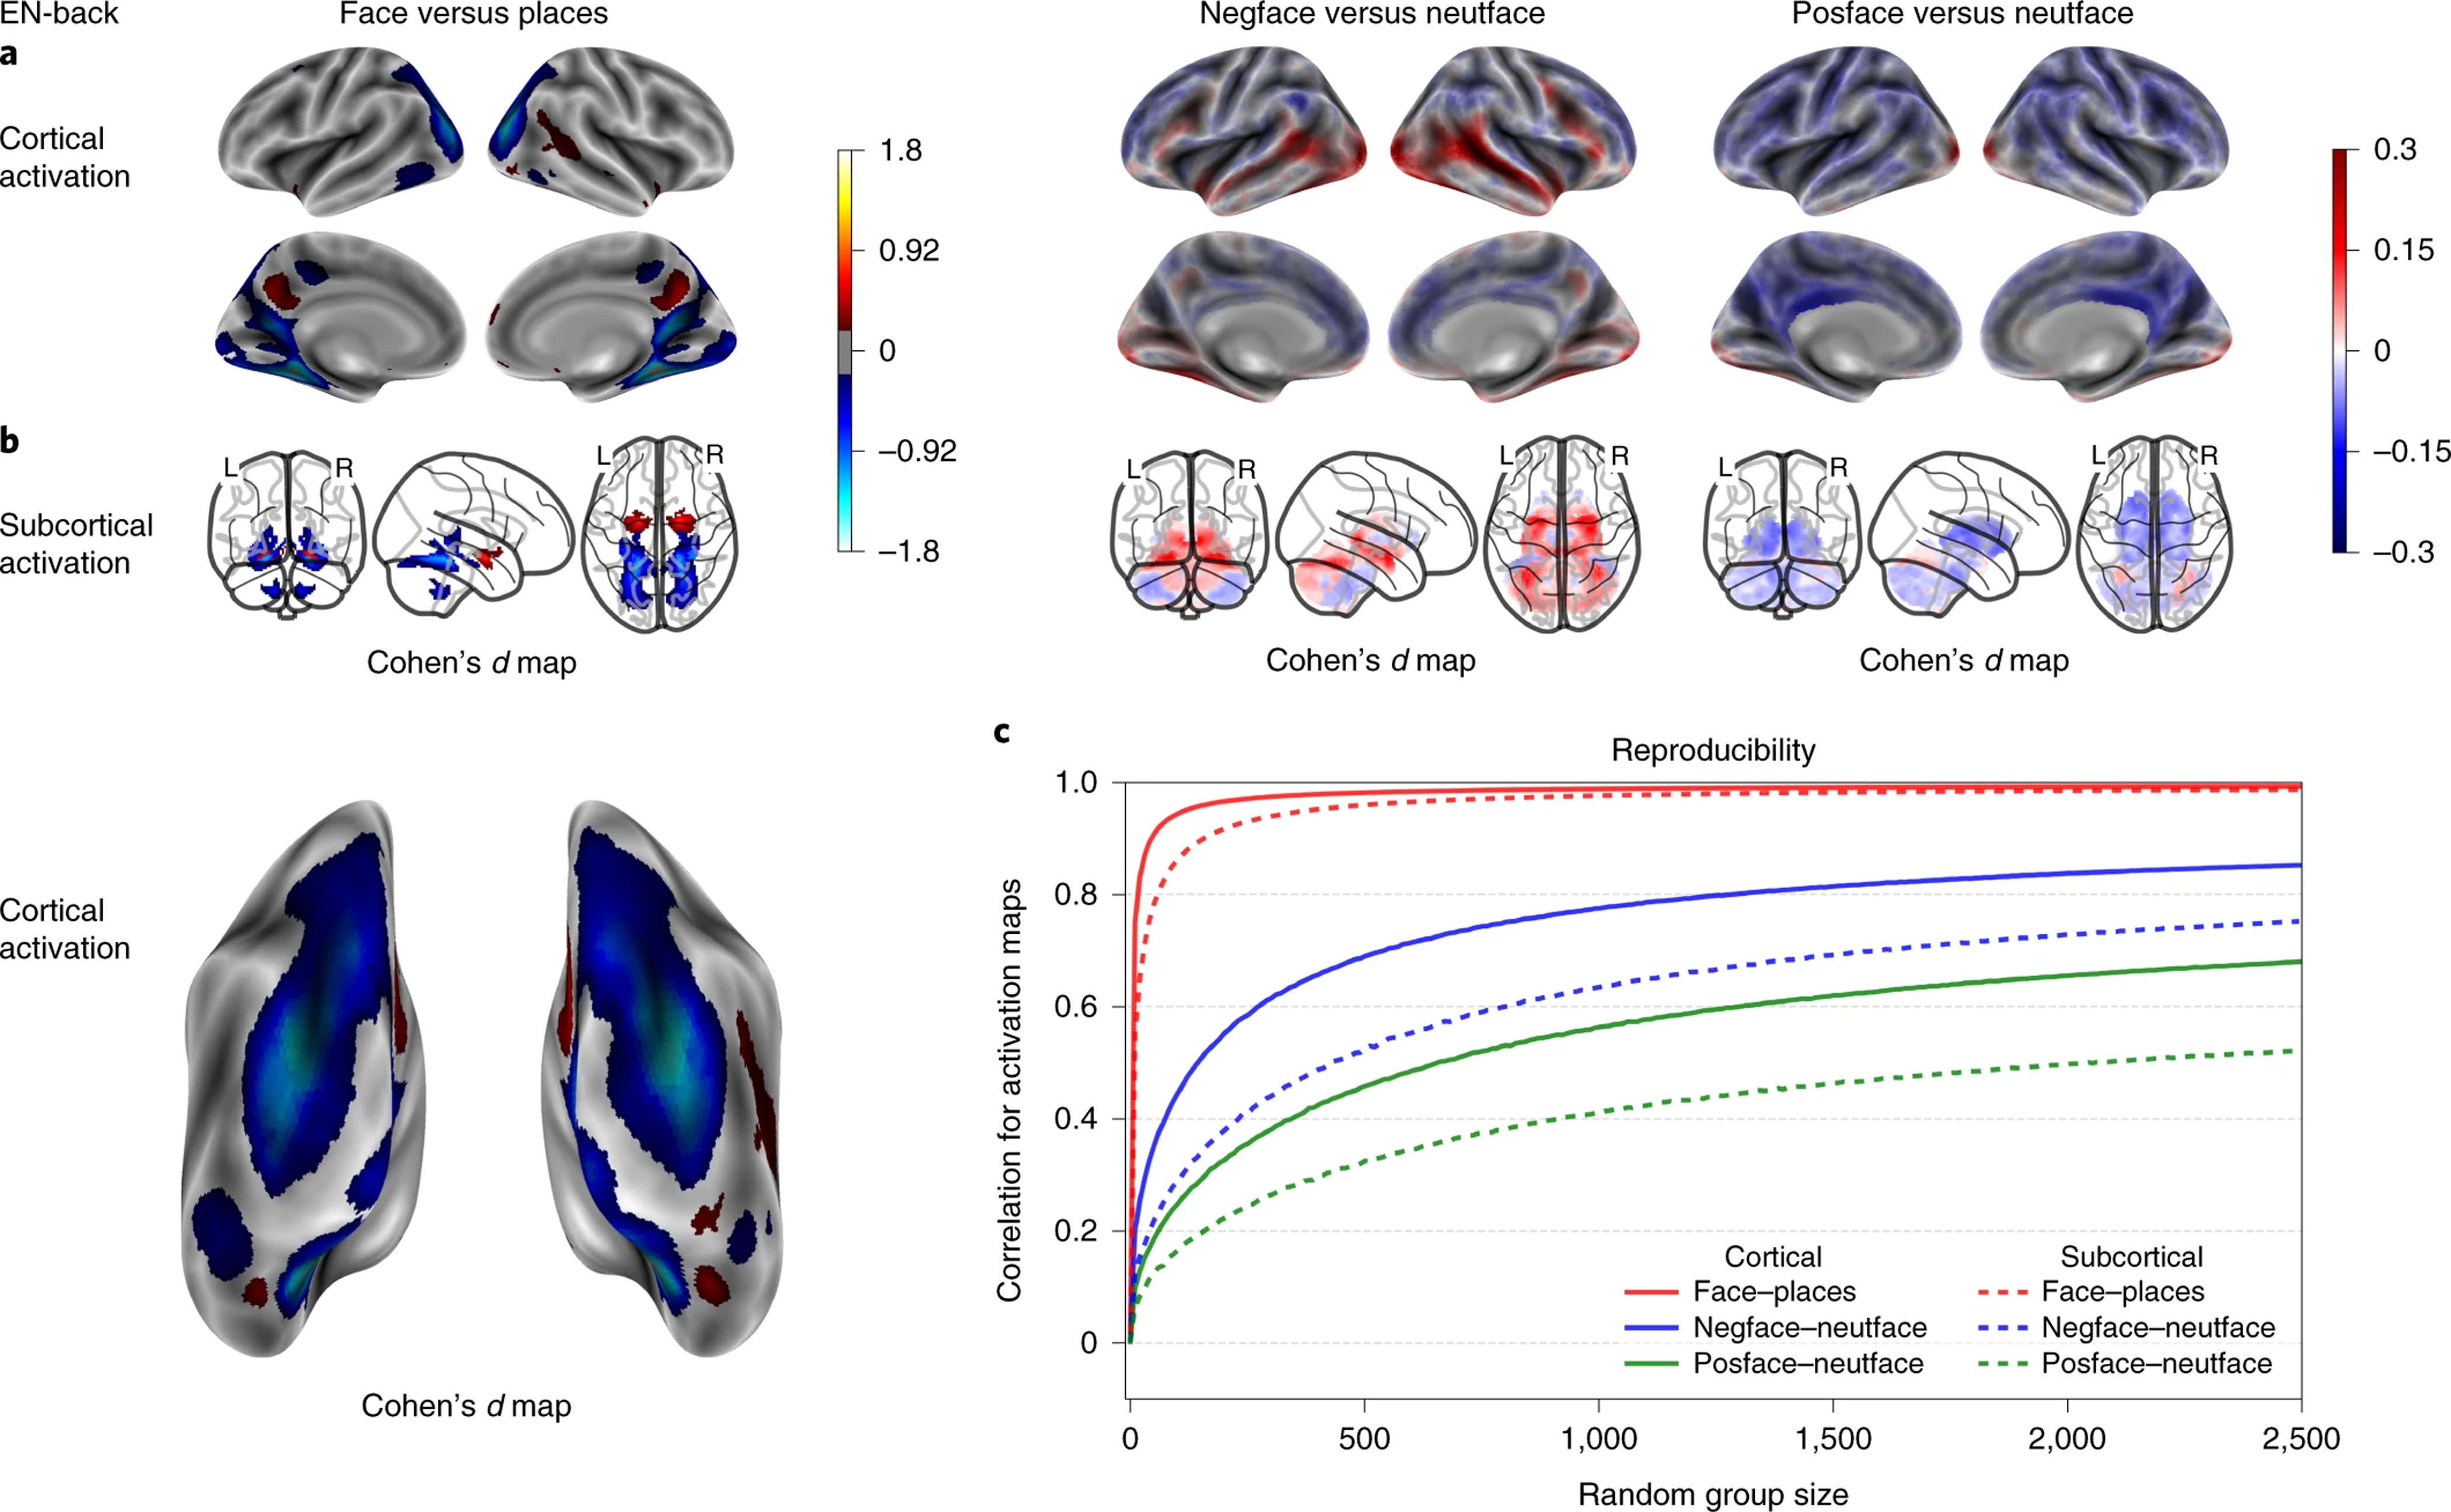
EN-back’s emotional activation maps, performance correlation maps and group-level spatial consistency at cortical and subcortical levels. Cohen’s d maps are thresholded at ≥ 0.2 in magnitude to only display small, medium, and large effect sizes. No thresholding is applied to the correlation maps. N=6,009.