


Figure 4. Electrophysiology corroborates frequency-dependent fMRI signals.
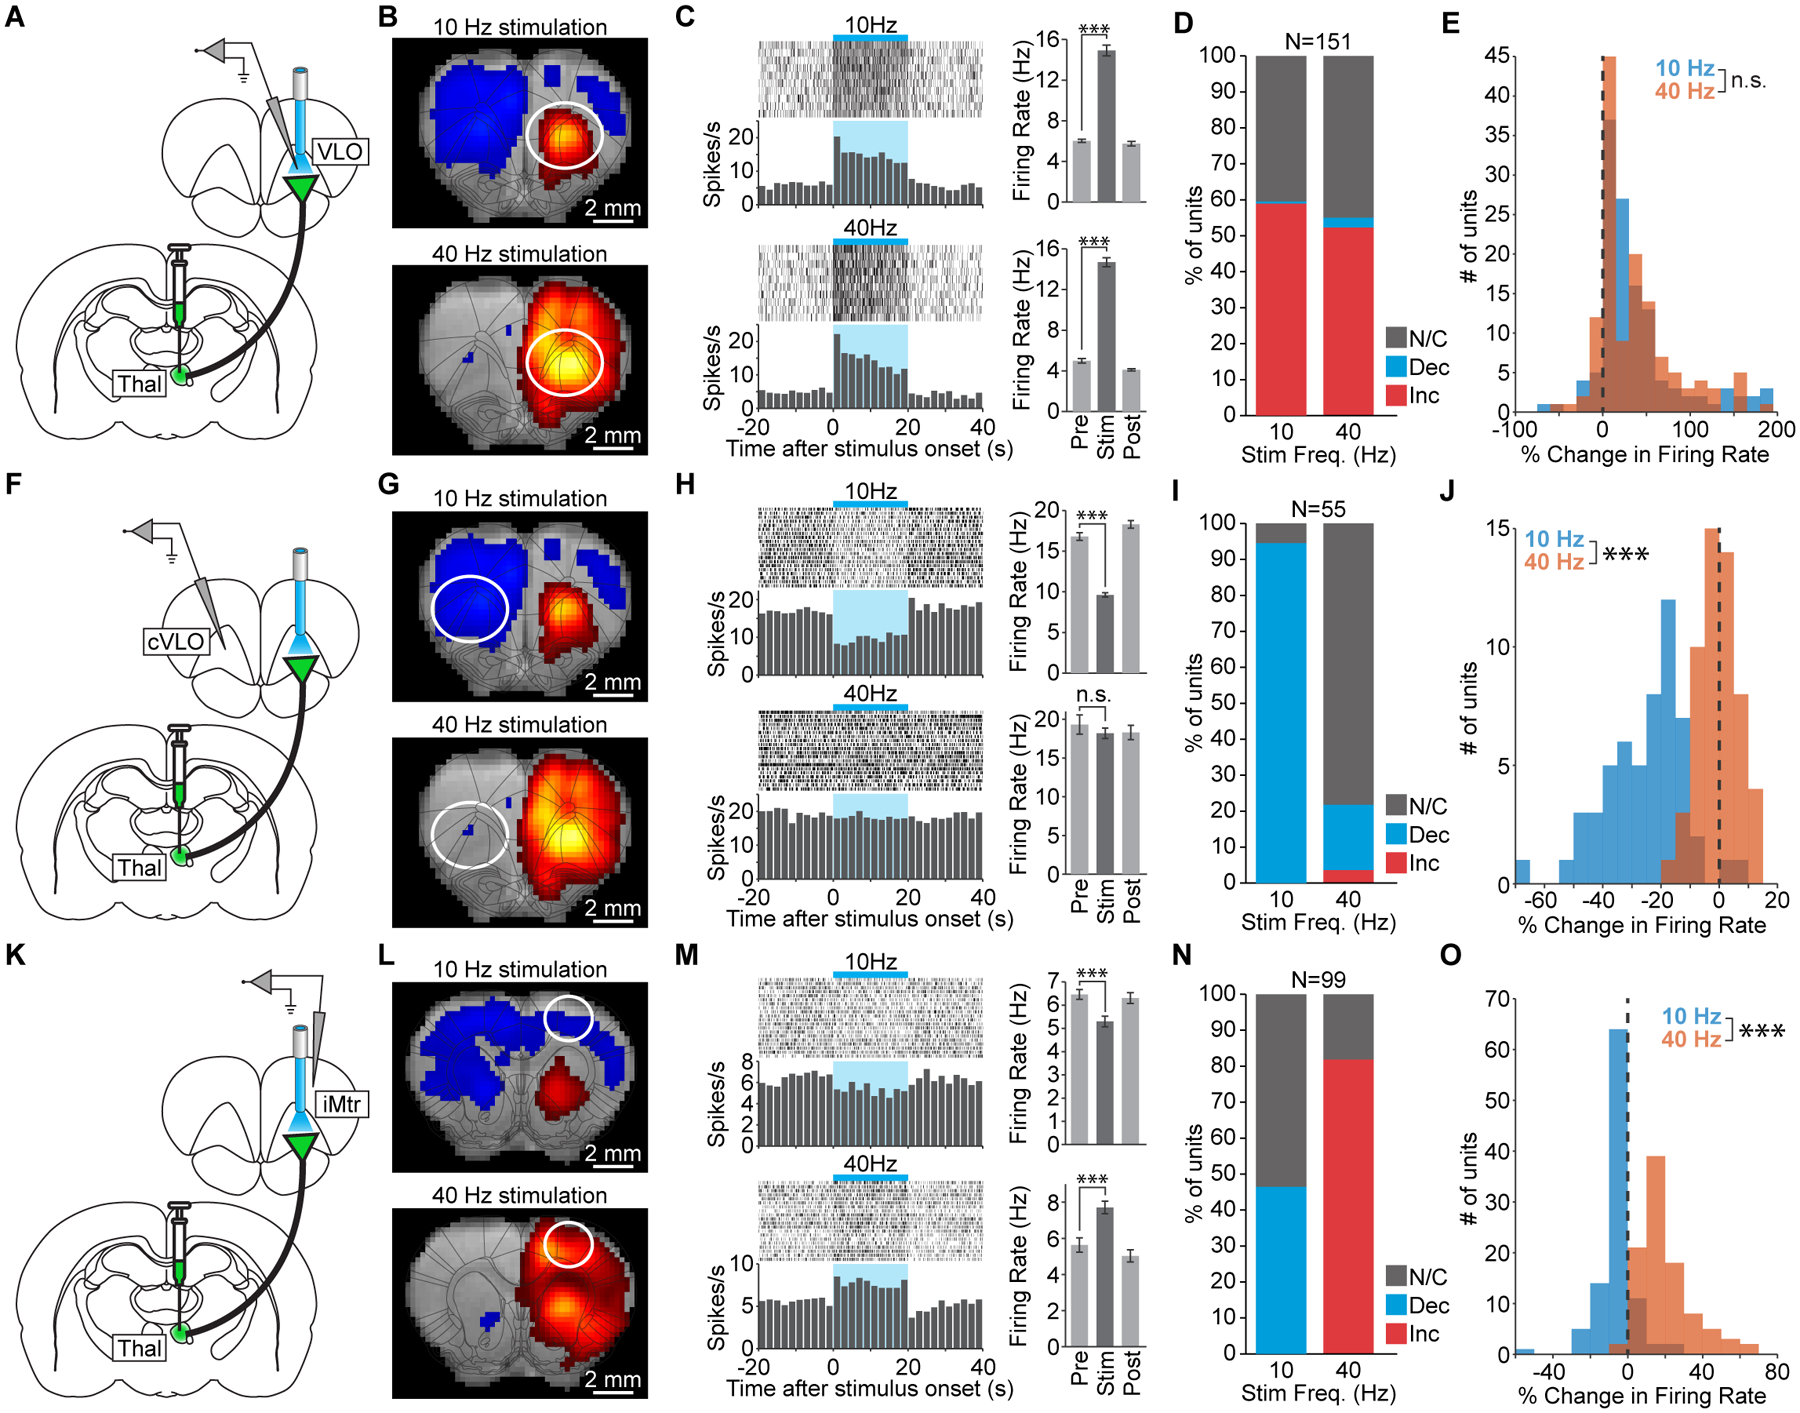
(A) Schematic of single-unit recordings at the site of stimulation in VLO. (B) 10 and 40 Hz stimulations drive robust positive fMRI signals at the site of stimulation. (C) Peri-event time histograms from a representative unit in VLO that is excited during 10 and 40 Hz stimulation (p=1.2×10⁻⁷ and 7.6×10⁻¹⁰, respectively). Error bars represent mean ± s.e.m. over trials. (D) Quantification of significant changes in firing rate across recorded units. INC: increase, DEC: decrease, N/C: no change. (E) Histograms of stimulus-evoked changes in VLO firing rate (n.s. not significant; p=0.38). (F) Schematic of single-unit recordings in the contralateral VLO (cVLO). (G) 10 Hz stimulation drives a robust negative fMRI signal in cVLO that largely disappears during 40 Hz stimulation. (H) Peri-event time histograms from a representative unit in cVLO. The firing rate decreases during 10 Hz stimulation (p=4.6×10⁻¹³) but does not change during 40 Hz stimulation (p=0.42). (I) Quantification of significant changes in firing rate across recorded units in cVLO. (J) Histograms of stimulus-evoked changes in cVLO firing rate (p=4.5×10⁻¹⁷). (K) Schematic of single-unit recording in the ipsilateral motor cortex (iMtr). (L) 10 Hz thalamocortical stimulation drives a negative fMRI response in iMtr, while 40 Hz stimulation drives a positive fMRI response. (M) Peri-event time histograms from a representative unit in iMtr that is inhibited during 10 Hz stimulation (p=3.4×10⁻⁴) but excited during 40 Hz stimulation (p=2.6×10⁻⁶). (N) Quantification of significant changes in firing rate across recorded units in iMtr. (O) Histograms of stimulus-evoked changes in iMtr firing rate (p=3.9×10⁻²⁹). See also Figure S5.