


Figure 5. The balance of activity between PVNs and NVNs controls reward seeking during motivational conflict.
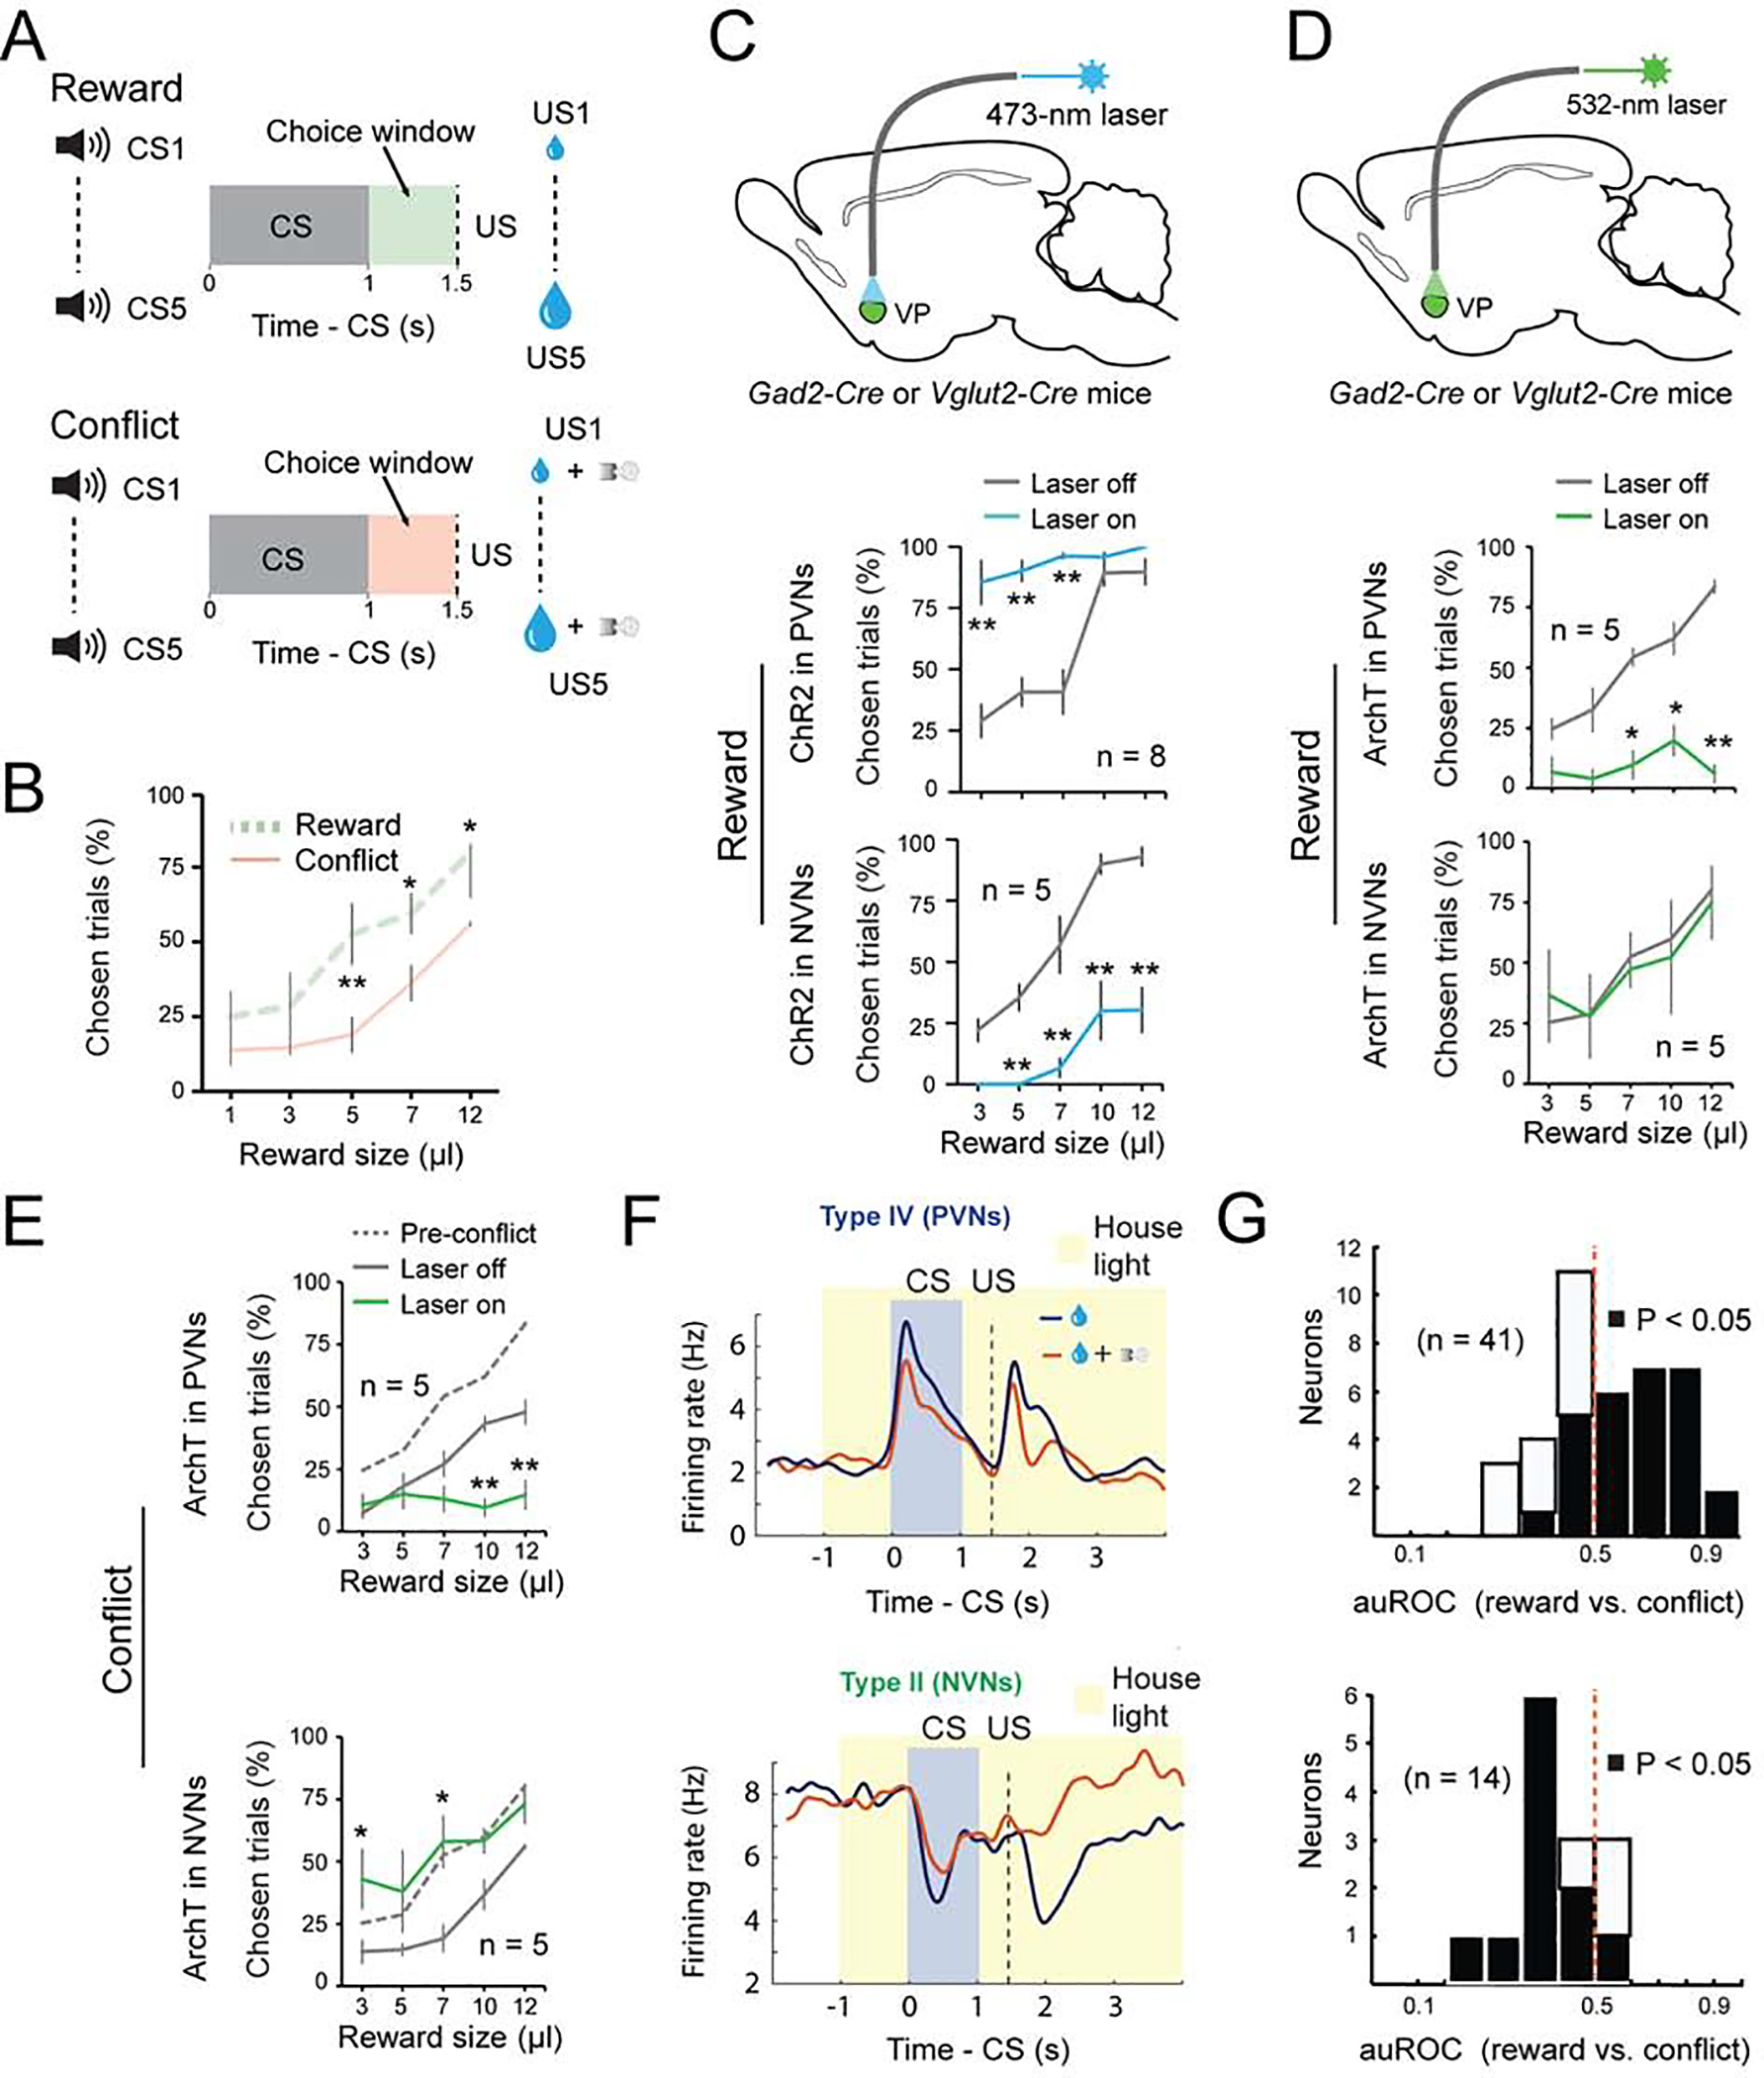
(A) Schematics of the experimental design. (B) Motivational conflict reduced reward seeking (F(1, 9) = 35.19, p < 0.0001). **p < 0.01, *p < 0.05, two-way ANOVA followed by Tukey’s test. (C) Top: a schematic of the approach. Middle: activation of PVNs increased reward seeking (F(1, 15)= 92.32, p < 0.001). Bottom: activation of NVNs decreased reward seeking (F(1, 7) = 108.68, p < 0.001). **P < 0.01, two-way ANOVA followed by Tukey’s test. (D) Top: a schematic of the approach. Middle: inhibition of PVNs decreased reward seeking (F(1, 9) = 50.37, p < 0.0001). Bottom: inhibition of NVNs had no effect on reward seeking (F(1, 9) = 0.055, p = 0.82). **P < 0.01, *P < 0.05, two-way ANOVA followed by Tukey’s test. (E) Top: inhibition of PVNs further decreased reward seeking in the conflict task (F(1, 9) = 27.60, p < 0.0001). Bottom: inhibition of NVNs increased reward seeking to pre-conflict levels (F(1, 9) = 50.37, p < 0.0001). **p < 0.01, *p <0.05, two-way ANOVA followed by Tukey’s test. (F) Average response of PVNs (top; n = 41, from two mice) or NVNs (bottom; n = 14, from two mice) in reward or conflict trials, shown as spike density plots. (G) auROC analysis of difference in the CS response during reward and conflict trials. Top: PVNs (n = 41 from two mice); bottom: NVNs (n = 14, from two mice). Filled bars, P<0.05, t-test. Data are presented as mean ± s.e.m.