


Fig. 6. Potential interactions between T cells and glia and neurons.
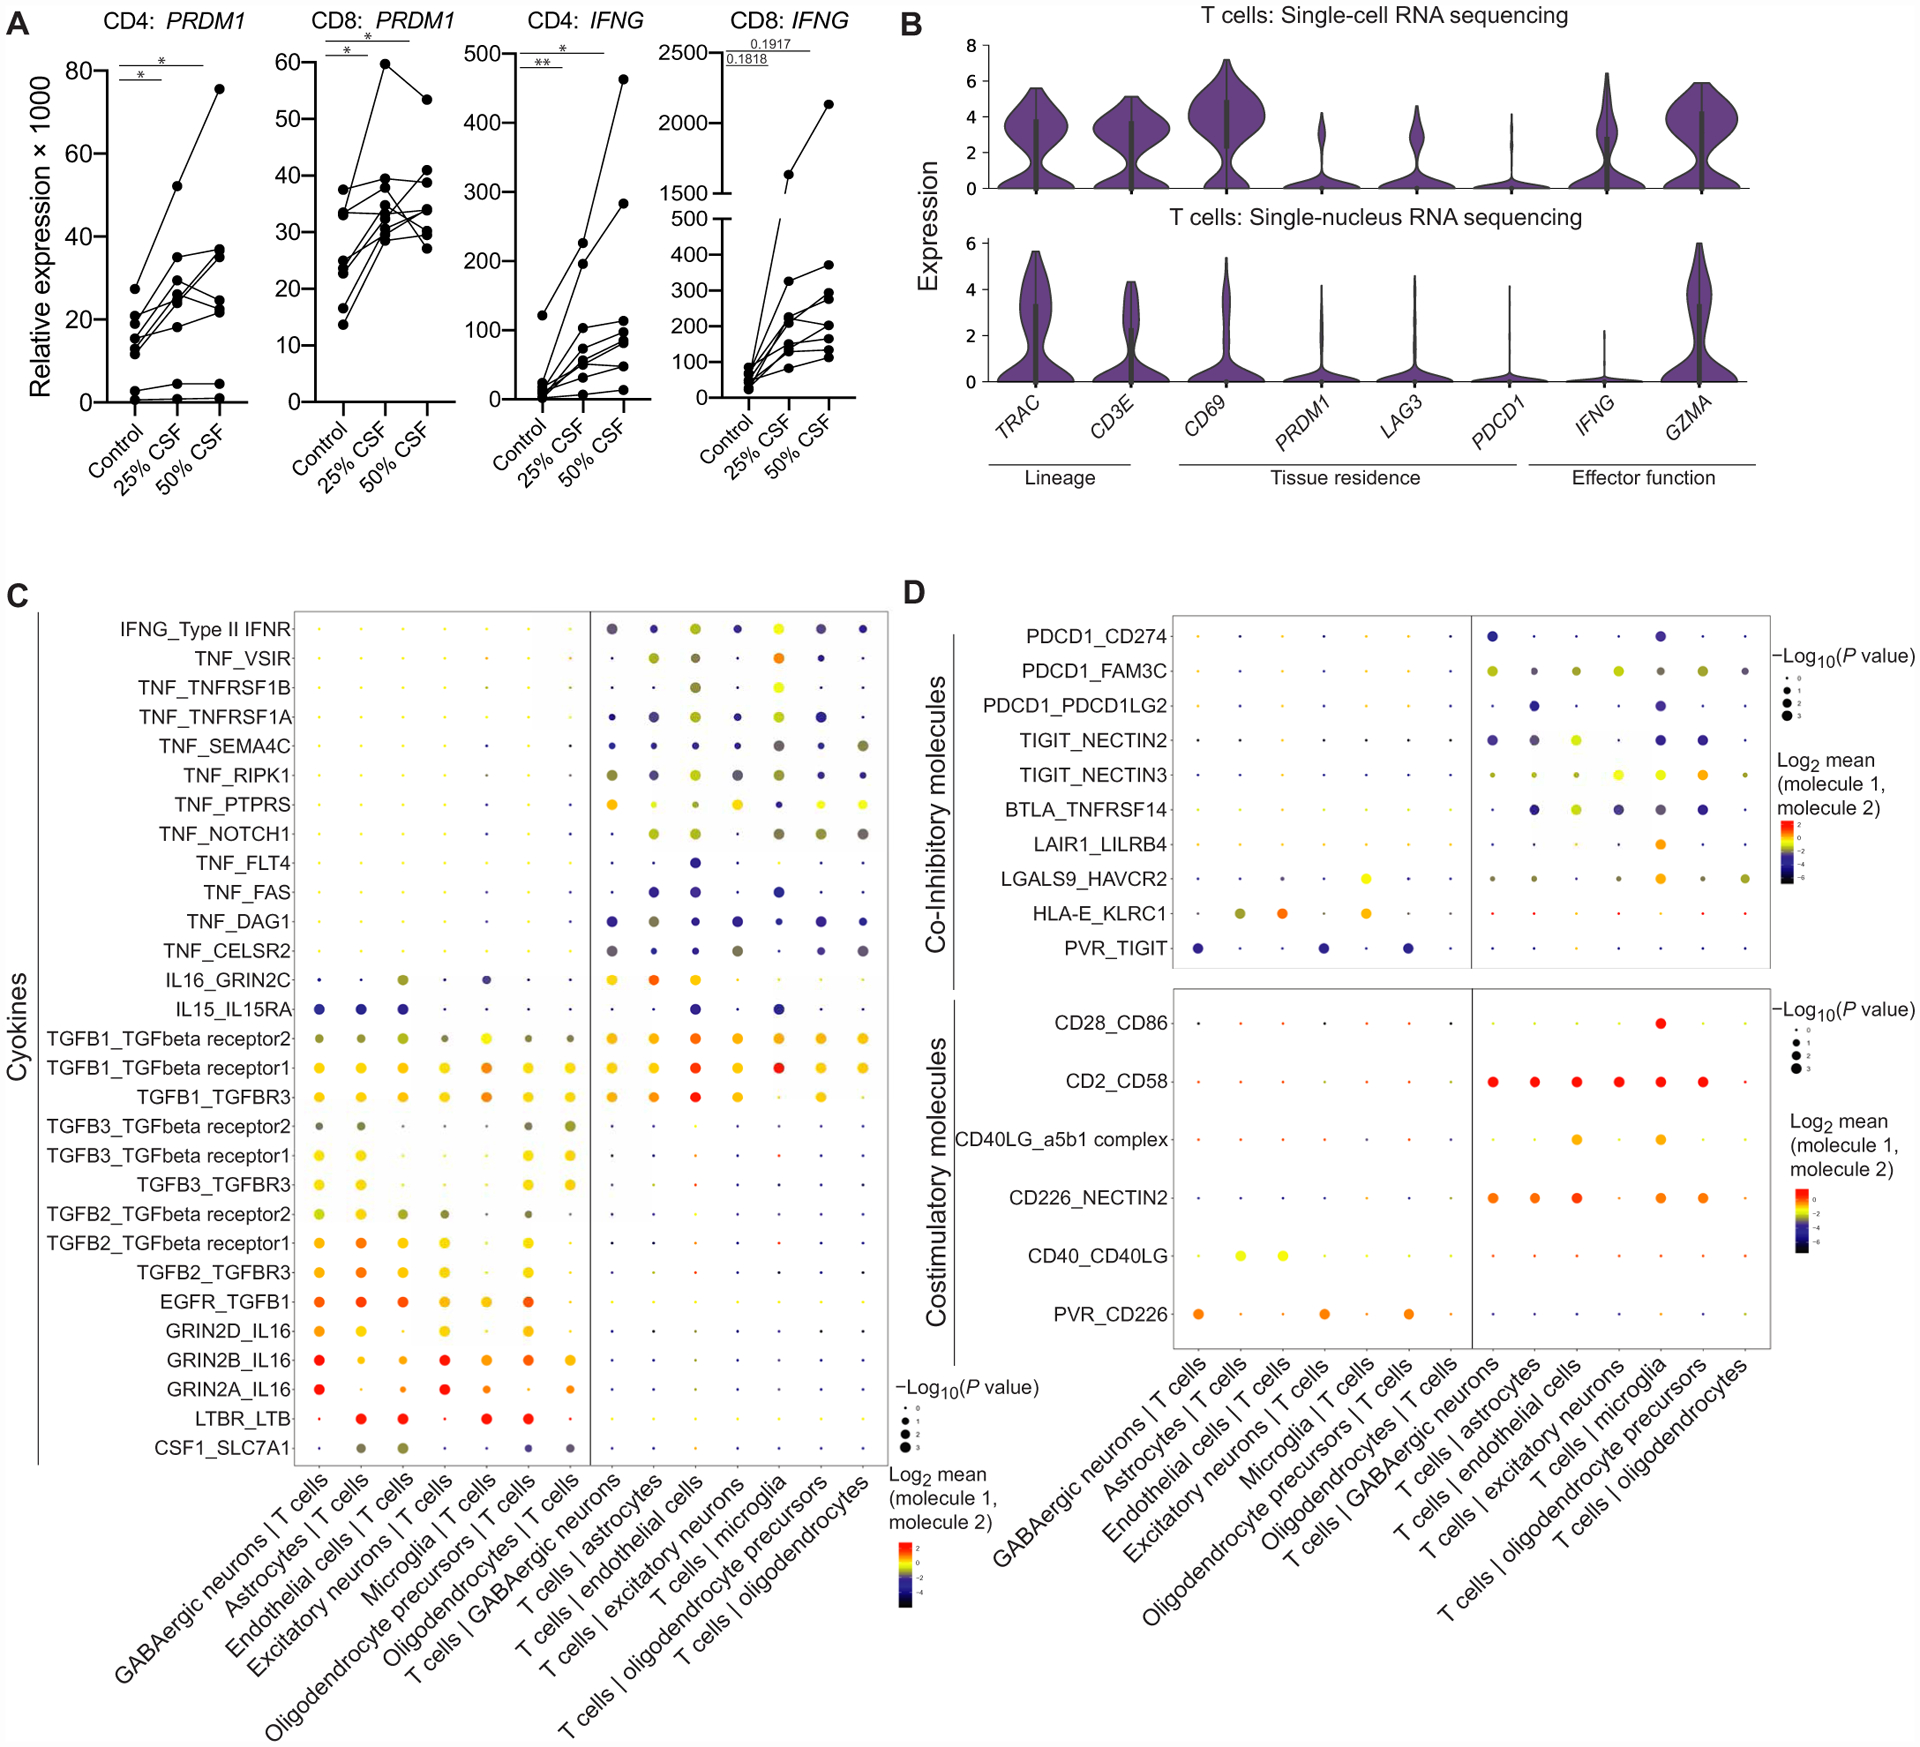
(A) qPCR results of CD4 or CD8 CD45RO+CXCR3+ T cells from the peripheral blood after they were stimulated with anti-CD3/anti-CD28 in XVIVO15 with or without the presence of healthy CSF supernatant for 48 hours (n = 9 healthy donors). Paired one-way ANOVA with Dunnett’s multiple comparisons test. PRDM1: *P = 0.0128 (CD4 25% CSF), *P = 0.0297 (CD4 50% CSF), *P = 0.0151 (CD8 25% CSF), and *P = 0.0351 (CD8 50% CSF); IFNG: **P = 0.0090 (CD4 25% CSF), **P = 0.0270 (CD4 50% CSF), P = 0.1818 (CD8 25% CSF), P = 0.1917 (CD8 50% CSF). (B) Violin plots of selected genes related to lineage, tissue residence, and functional gene expression in T cells within the brain parenchyma in scRNA-seq (top) (n = 3 donors, 319 T cells) and snRNA-seq (bottom) (n = 3 donors, 233 T cells) (table S8). (C) Dot plot of cell-cell interactions between T cells and glia/neurons from snRNA-seq data (n = 3, 233 T cells, 16,604 parenchymal cells) that involve cytokines calculated by CellPhoneDB (table S9). (D) Dot plot of cell-cell interactions between T cells and glia/neurons from snRNA-seq data (n = 3 donors, 233 T cells, 16,604 parenchymal cells) that involve coinhibitory and costimulatory molecules calculated by CellPhoneDB (table S9).