


FIGURE 1.
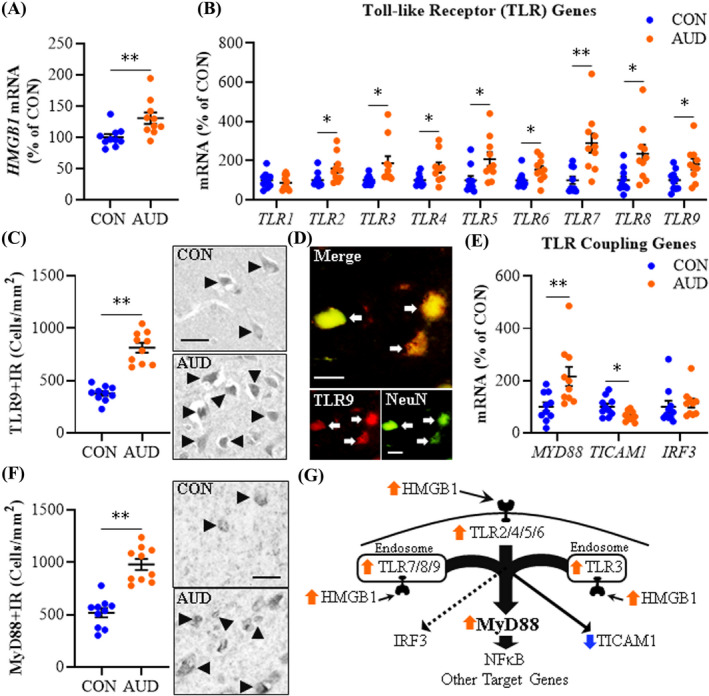
Expression of Toll‐like receptors (TLRs) and high‐mobility group box 1 (HMGB1) in age‐matched moderate drinking control (CON) and alcohol use disorder (AUD) postmortem human orbitofrontal cortex (OFC). (A) Reverse transcription PCR (RT‐PCR) analysis revealed AUD increased HMGB1 expression approximately 1.4‐fold relative to CONs. (B) RT‐PCR analysis revealed AUD increased expression of TLR2 (1.6‐fold), TLR3 (1.9‐fold), TLR4 (1.5‐fold), TLR5 (2.1‐fold), TLR6 (1.5‐fold), TLR7 (2.9‐fold), TLR8 (2.4‐fold), and TLR9 (1.8‐fold) relative to CONs. (C) Modified unbiased stereological assessment revealed a 2.2‐fold increase of TLR9+IR in the AUD OFC relative to CONs. Representative photomicrographs of TLR9+IR in the OFC of a CON and AUD sample. Black arrowheads indicate TLR9+IR cells. Scale bar = 30 μm. (D) Immunofluorescent co‐labeling revealed a high degree of TLR9 (red) colocalization with the neuronal marker NeuN (green) in the postmortem human OFC. White arrows indicate TLR9+IR cells that colocalize with NeuN (top; yellow). Scale bar = 20 μm. (E) RT‐PCR analysis revealed AUD increased expression of MYD88 (2.2‐fold) and decreased expression of TICAM1 (TRIF; 35% ±6%) relative to CONs. (F) Modified unbiased stereological assessment revealed an approximate 2‐fold increase of MyD88+IR in the AUD OFC relative to CONs. Representative photomicrographs of MyD88+IR in the OFC of a CON and AUD sample. Black arrowheads indicate TLR9+IR cells. Scale bar = 30 μm. (G) Simplified schematic depicting HMGB1 signaling through TLRs and TLR coupling adaptors to NF‐κB and other target genes. RT‐PCR analyses were run in triplicate. Data are presented as mean ±SEM. * p ≤ 0.05, ** p < 0.01