


FIGURE 8.
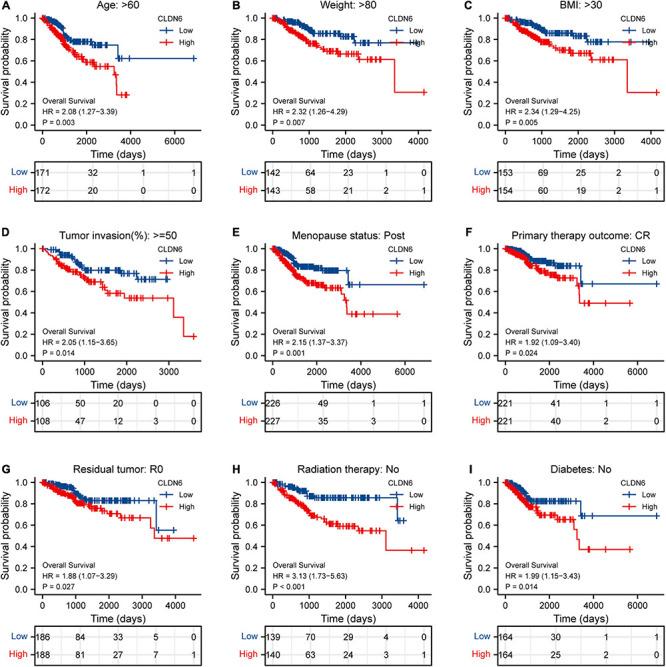
Associations between CLDN6 expression and the OS in different clinical subgroups of UCEC. (A) Age > 60; (B) weight > 80; (C) BMI > 30; (D) tumor invasion ≥ 50%; (E) postmenopause; (F) primary therapy outcome (CR); (G) residual tumor (R0); (H) radiation therapy (No); (I) diabetes (No).