


Figure 2. Linear Latent Growth Curve Model of Change in the Outcome Variable Across Seven Time-Points.
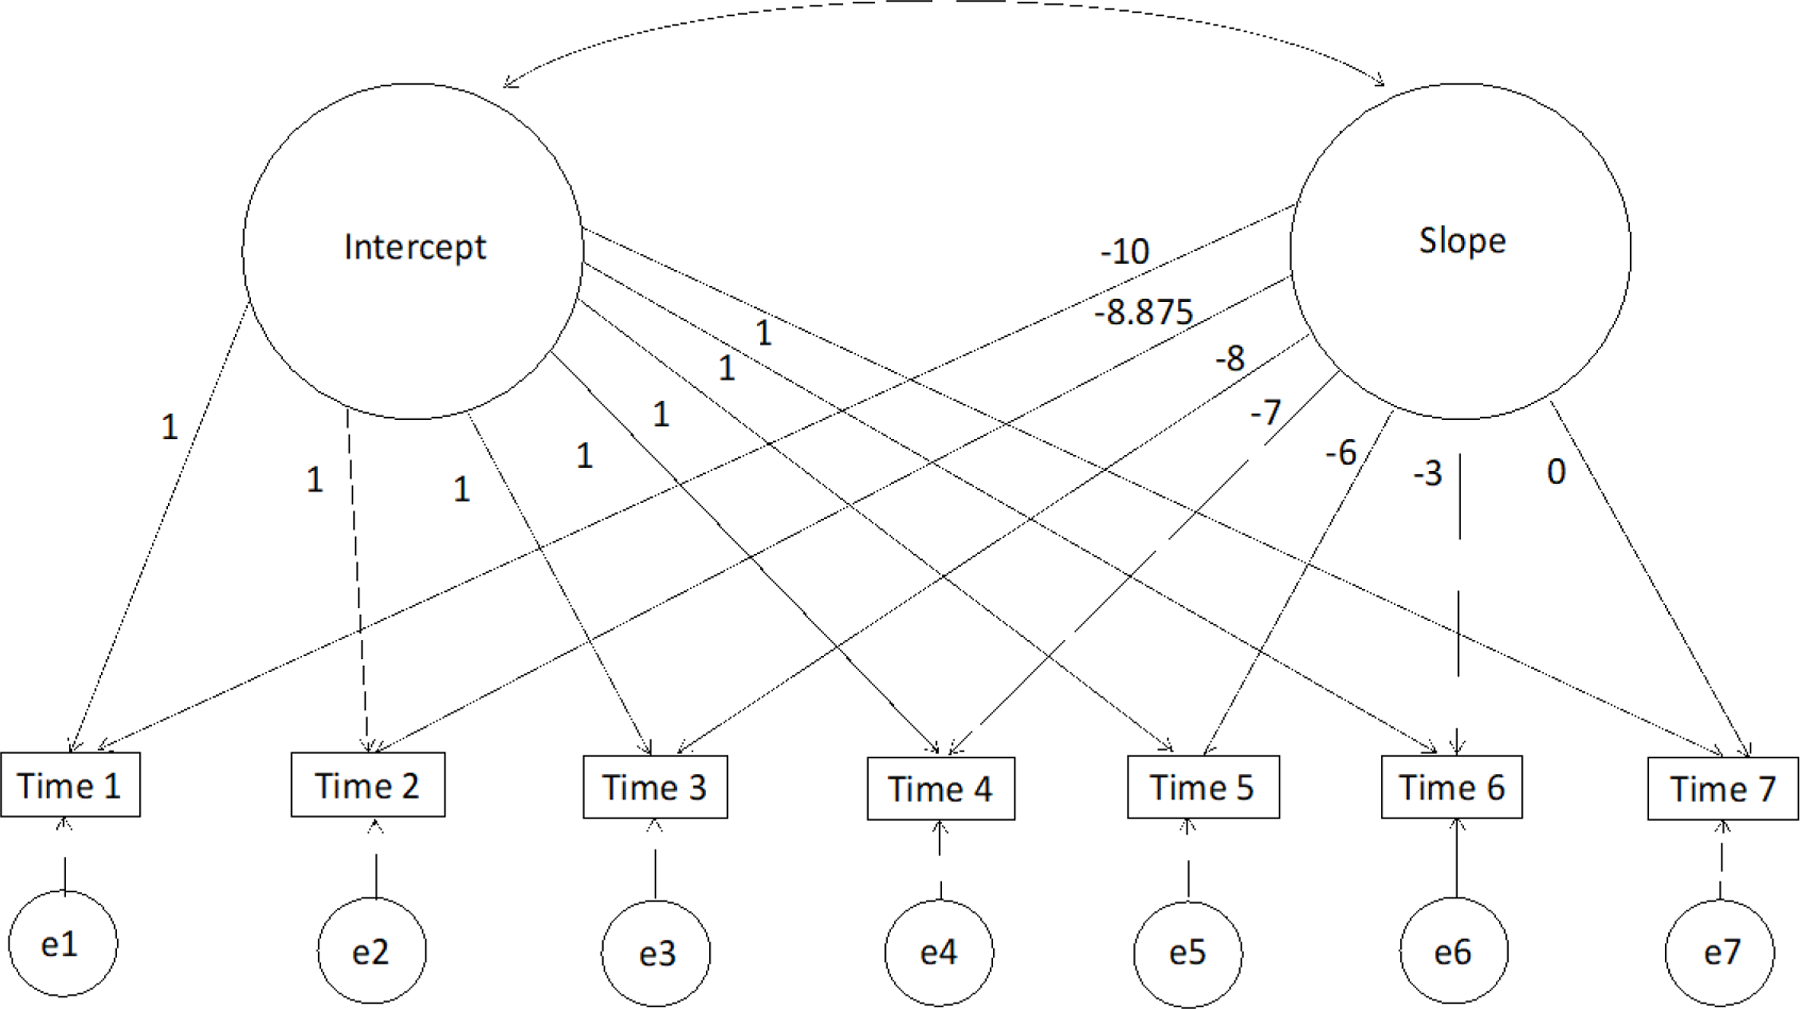
Note. LGCMs or curve-of-factor models were evaluated separately for each outcome variable (i.e., diabetes-specific distress, depressive symptoms, glycemic control, blood glucose monitoring frequency, diabetes management behaviors, time in range). The intercept was set at the final time-point (40 months post-baseline) by specifying the zero point of the slope factor at T7. The loadings of the linear slope factor across the seven respective time-points were set to the amount of time between assessment time-points (−10, −8.875, −8, −7, −6, −3, 0 months), with a one-unit change in time equal to four months.