


Fig. 5. Increased [K+]e-mediated metabolic reprogramming is mediated by AcCoA subcellular abundance and autophagy.
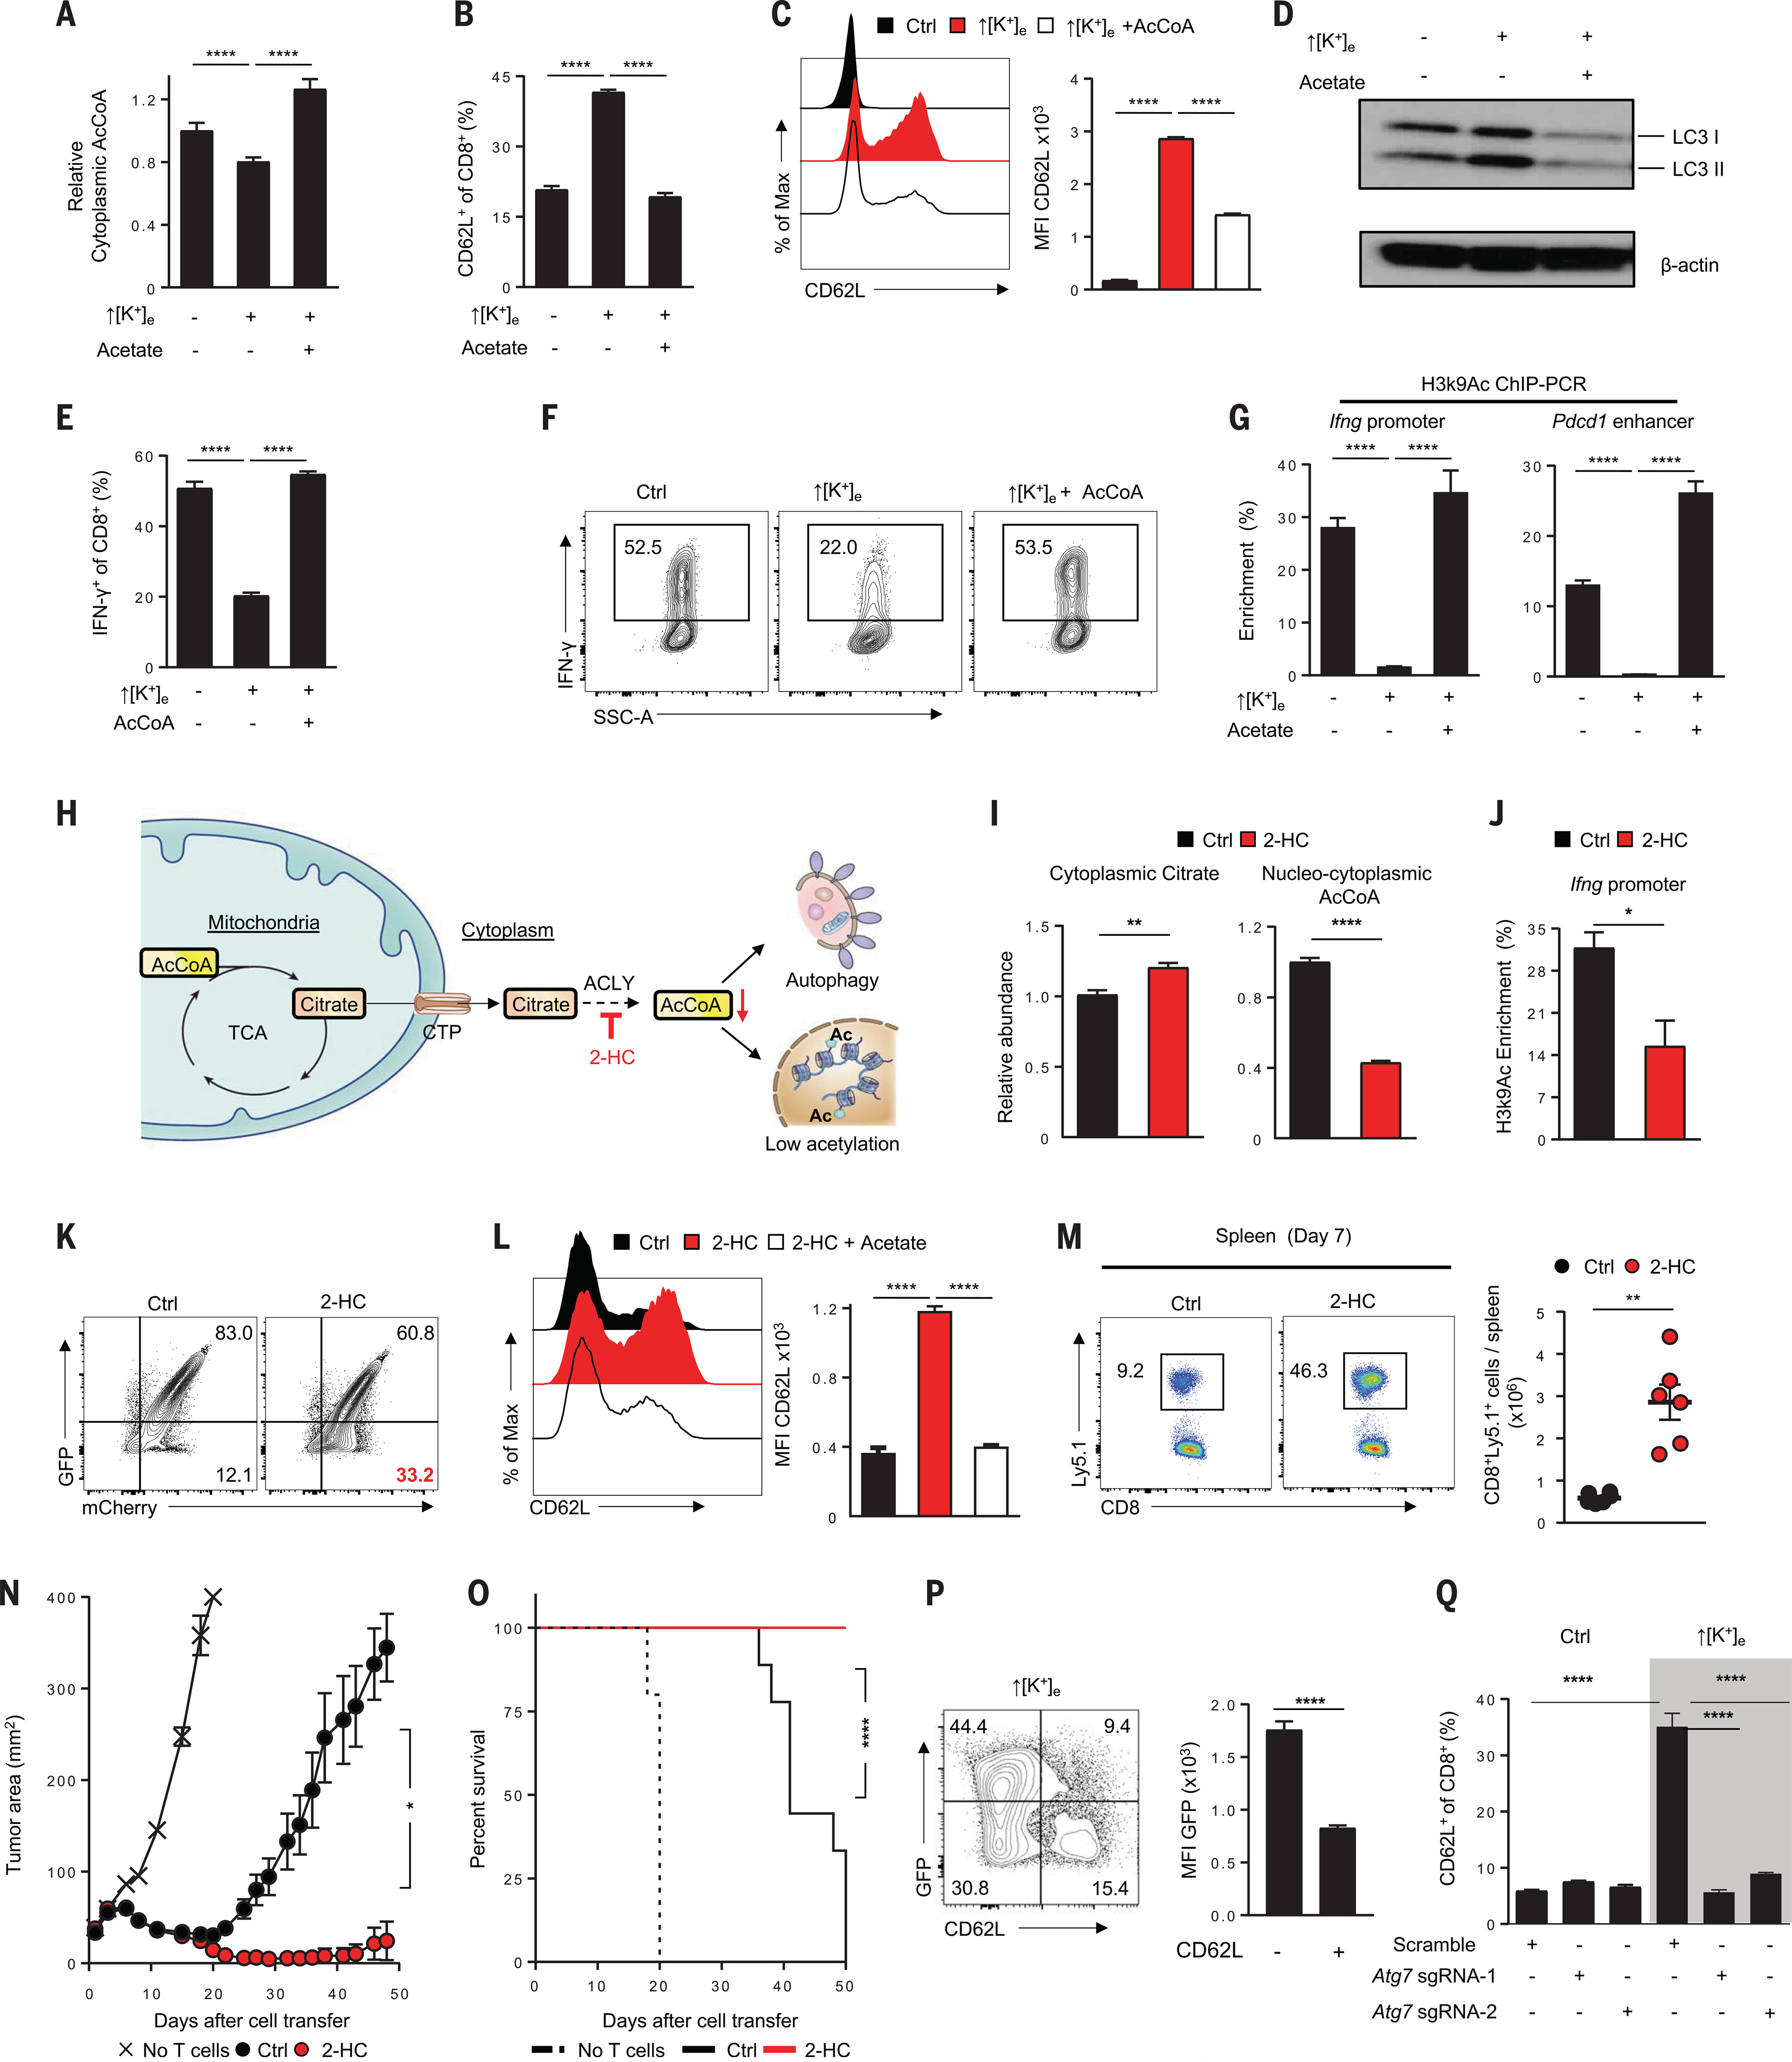
(A) Rescue of ↑[K+]e effects on cytoplasmic AcCoA by external acetate (5 mM) supplementation. (B and C) Representative FACS plot quantifications of effects of external acetate (B) and electroporated AcCoA(50 μM) (C) on CD62L cell surface expression in CD8+ T cells in the indicated conditions. Data are means ± SEM and are representative of two (A) or three [(B) and (C)] independent experiments. (D) Immunoblot showing reduction of autophagy in ↑[K+]e by provision of external acetate. (E and F) Representative FACS plots and quantification showing augmentation of IFN-γ cytokine expression by electroporation of external AcCoA (50 mM). Data are means ± SEM and are representative of two independent experiments. (G) Quantifications of H3K9Ac enrichment by ChIP-PCR at the Ifng and Pdcd1 enhancer locus in the indicated conditions. Data are means ± SEM from at least three culture replicates. (H) Schematic of the molecular pathways, substrates, and associated enzymes involved in the generation of cytoplasmic AcCoA pools. CTP, citrate transporter; 2-HC, ACLY inhibitor (5 mM hydroxycitrate). (I) Quantification of cytoplasmic citrate and cytoplasmic AcCoA from the cells treated in the indicated conditions. (J) ChIP-PCR quantification showing reduced H3K9Ac deposition at the Ifng locus in 2-HC–treated cells. Data are means ± SEM and are representative of three (I) or two (J) independent experiments with n = 3 culture replicates per experiment. (K) Representative FACS plots of autophagy flux in the indicated conditions by measuring the loss of GFP in mCherry+ populations. (L) Representative FACS plots showing effect of external acetate supplementation on CD62L expression in 2-HC–treated cells. Data are means ± SEM and are representative of two independent experiments with n = 3 culture replicates per experiment. (M) Representative flow cytometry analysis (left) and absolute number quantification (right) of transferred Ly5.1+ CD8+ T cells in the spleen of tumor-bearing mice on day 7 in the indicated conditions. Data are representative of two independent experiments with at least n = 5 mice per group. (N and O) Antitumor efficacy (left) and survival rates in mice (right) bearing B16 tumors treated with pmel T cells cultured in control (n = 10) or 2-HC (n = 10). Tumor measurements were plotted as mean ± SEM for each data point; tumor treatment curves were compared by Wilcoxon rank sum test; animal survival was assessed by log-rank test. Data are representative of two independent experiments. (P) Representative flow cytometry analysis and quantifications showing reduced autophagic flux in CD62L− populations. Data are means ± SEM and are representative of two independent experiments with n = 3 culture replicates per experiment. (Q) Representative flow cytometry quantification showing abrogation of increased CD62L expression driven by ↑[K+]e upon genetic perturbation of Atg7 (highlighted in gray). *P < 0.05, **P < 0.01, ****P < 0.0001 (two-tailed t tests).