


Figure 5:
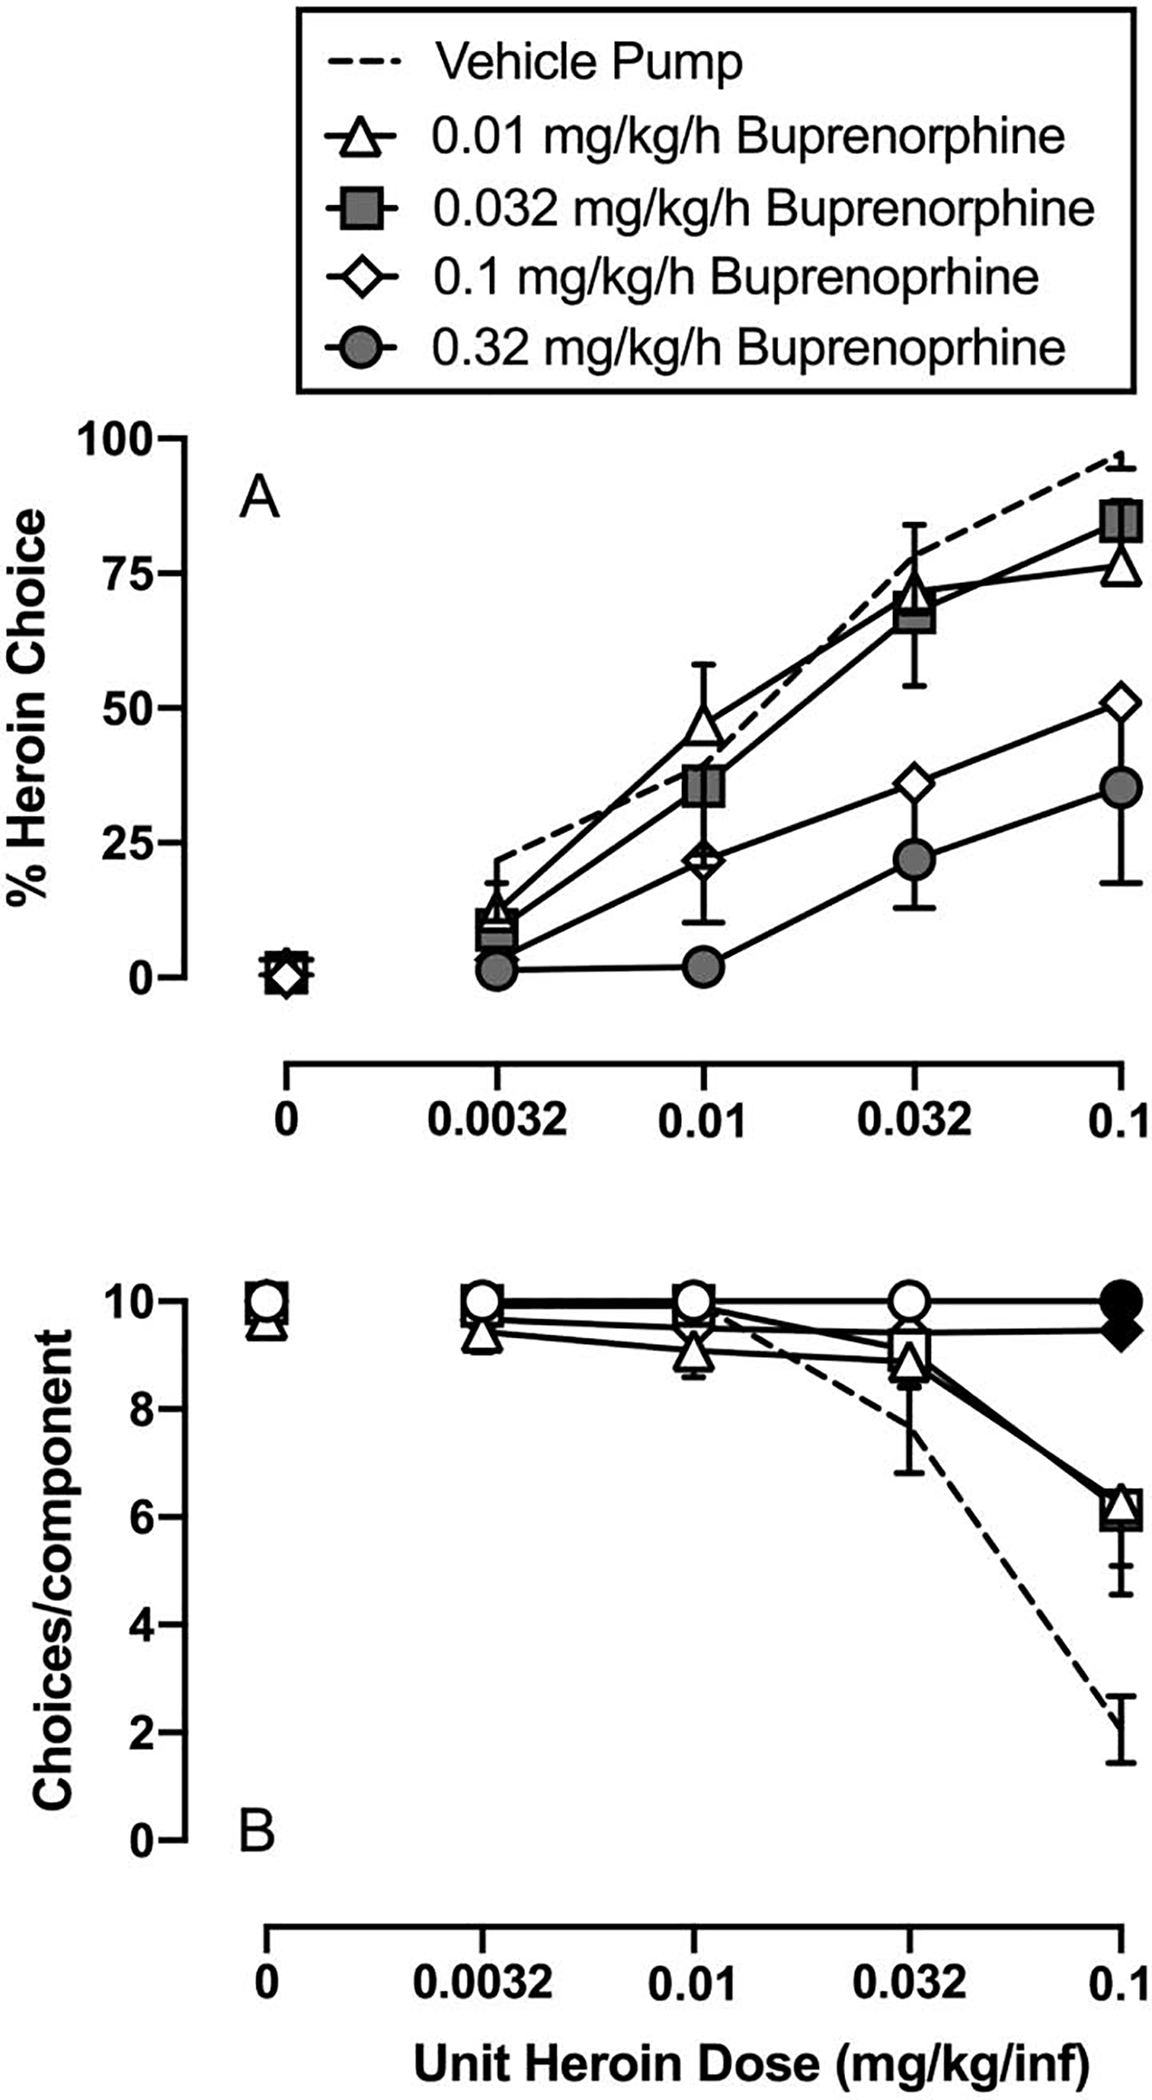
Effects of 7-day continuous 0.01–0.32 mg/kg/h buprenorphine treatment on heroin-vs-food choice in male and female rats. Top panels show percent heroin choice as a function of unit heroin dose in milligrams per kilogram per infusion. Bottom panels show the number of choices completed per component as a function of the unit heroin drug available as the alternative to 18% liquid food. All points represent the mean ± s.e.m. of 6 rats, except the 0.32 mg/kg/h buprenorphine dose, which is 5 rats. Gray filled symbols in Panel A denote statistical significance (p<0.05) compared to vehicle pump conditions regardless of unit heroin dose, whereas black filled symbols in Panel B denote statistical significance compared to vehicle pump conditions within a unit heroin dose.