


Figure 3:
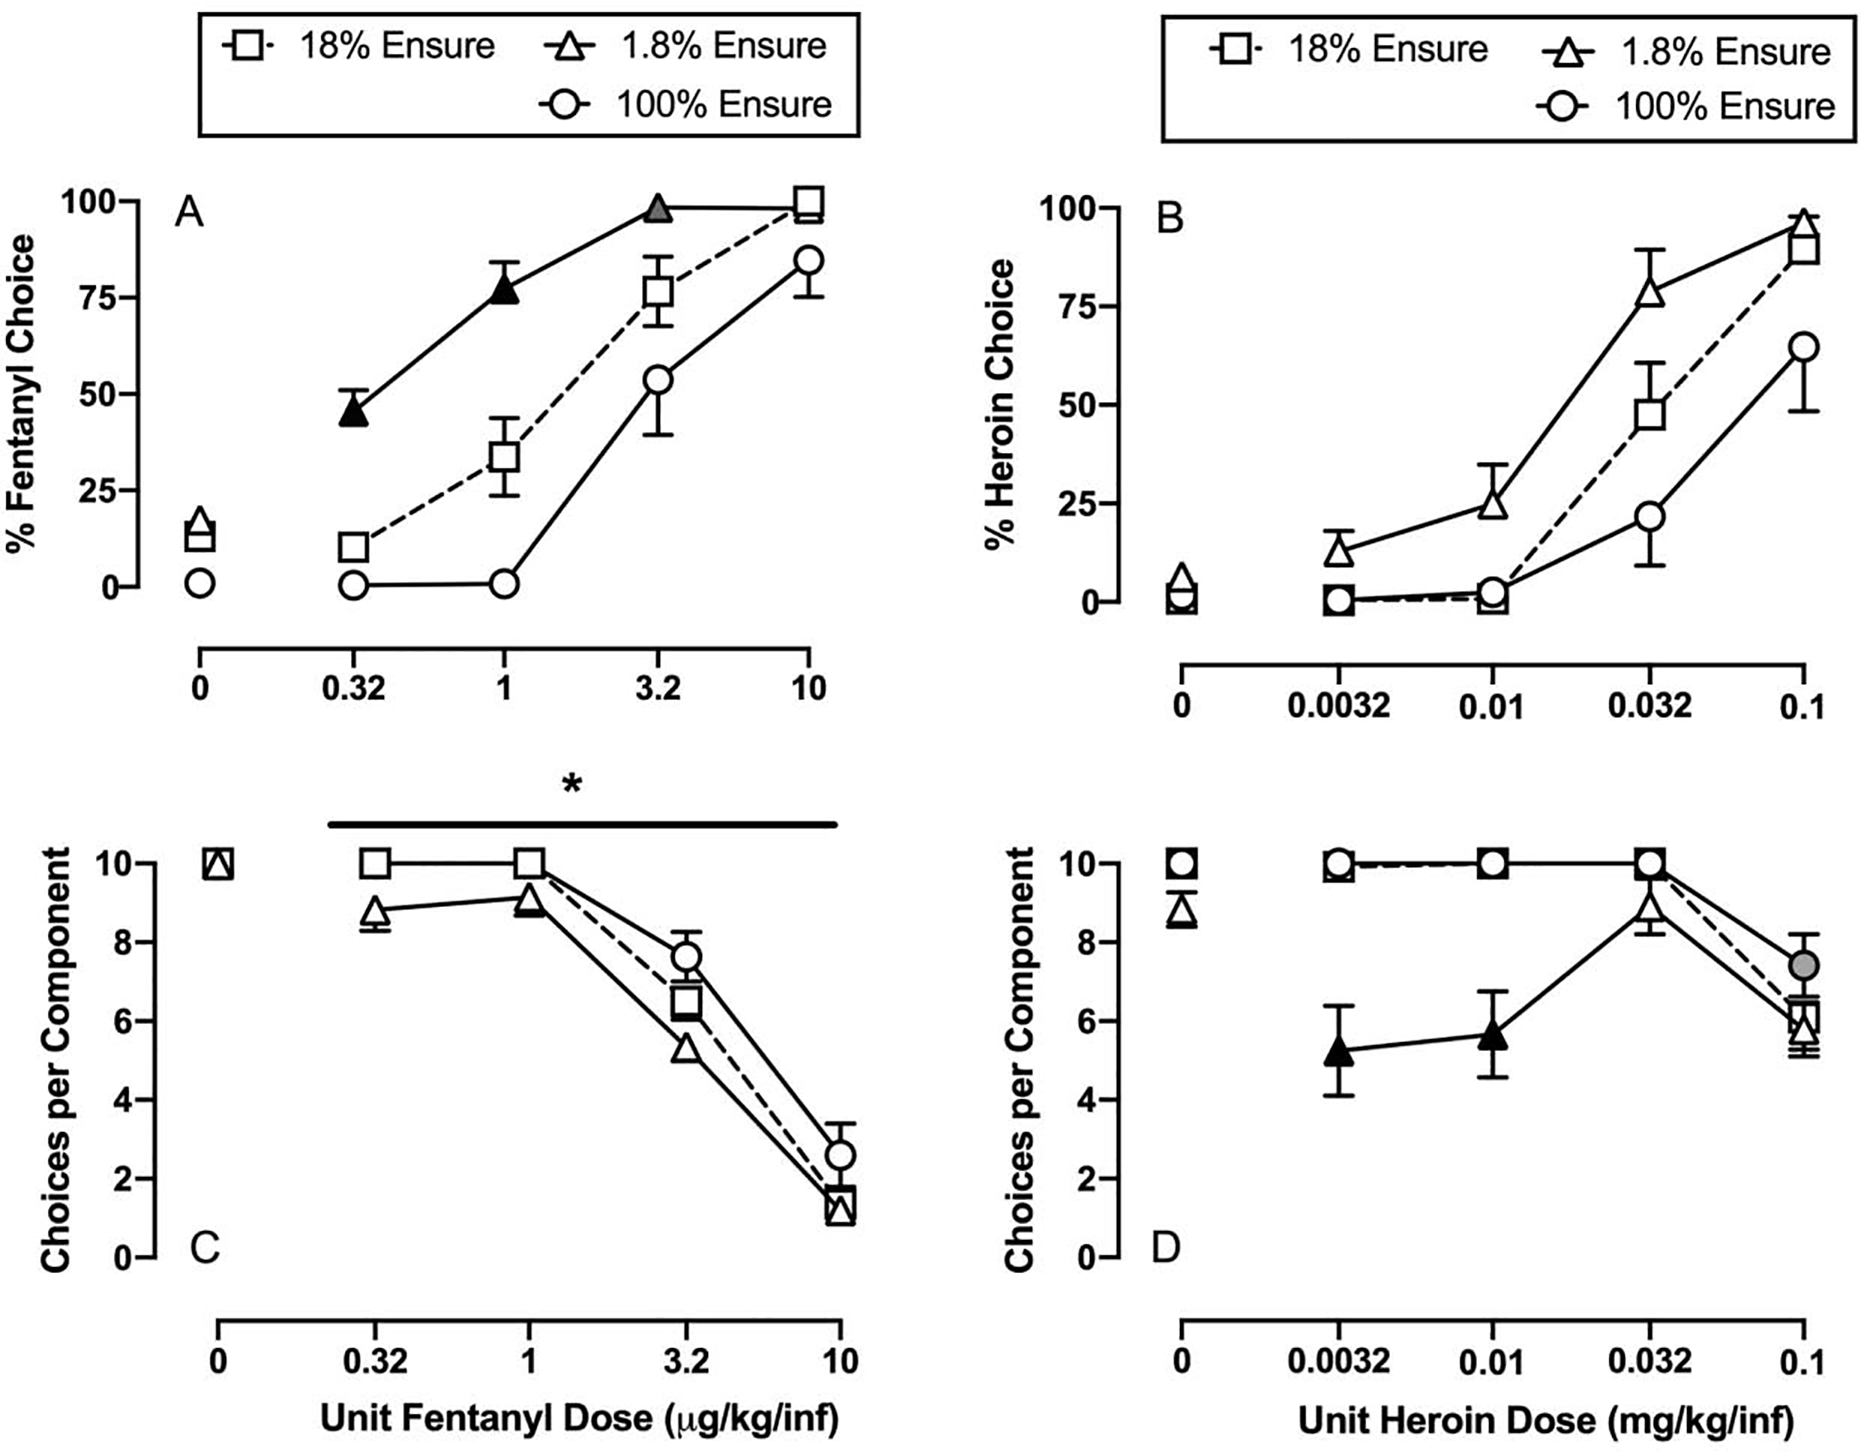
Food reinforcer-magnitude manipulations on fentanyl-vs-food choice (Panels A and C) and heroin-vs-food choice (Panels B and D) in male and female rats. Top panels show percent drug choice as a function of unit drug dose in either micrograms or milligrams per kilogram per infusion. Bottom panels show the number of choices completed per component as a function of the unit dose drug available as the alternative to liquid food (1.8–100%). All points represent the mean ± s.e.m. of 12 rats in the fentanyl experiments and 8 rats in the heroin experiments. Black filled symbols denote statistical significance (p<0.05) compared to all other liquid food concentrations and gray filled symbols denote statistical significance compared to 18% liquid food only. Asterisk denotes statistical significance between 1.8% and 100% liquid food regardless of unit fentanyl dose.