


Figure 1:
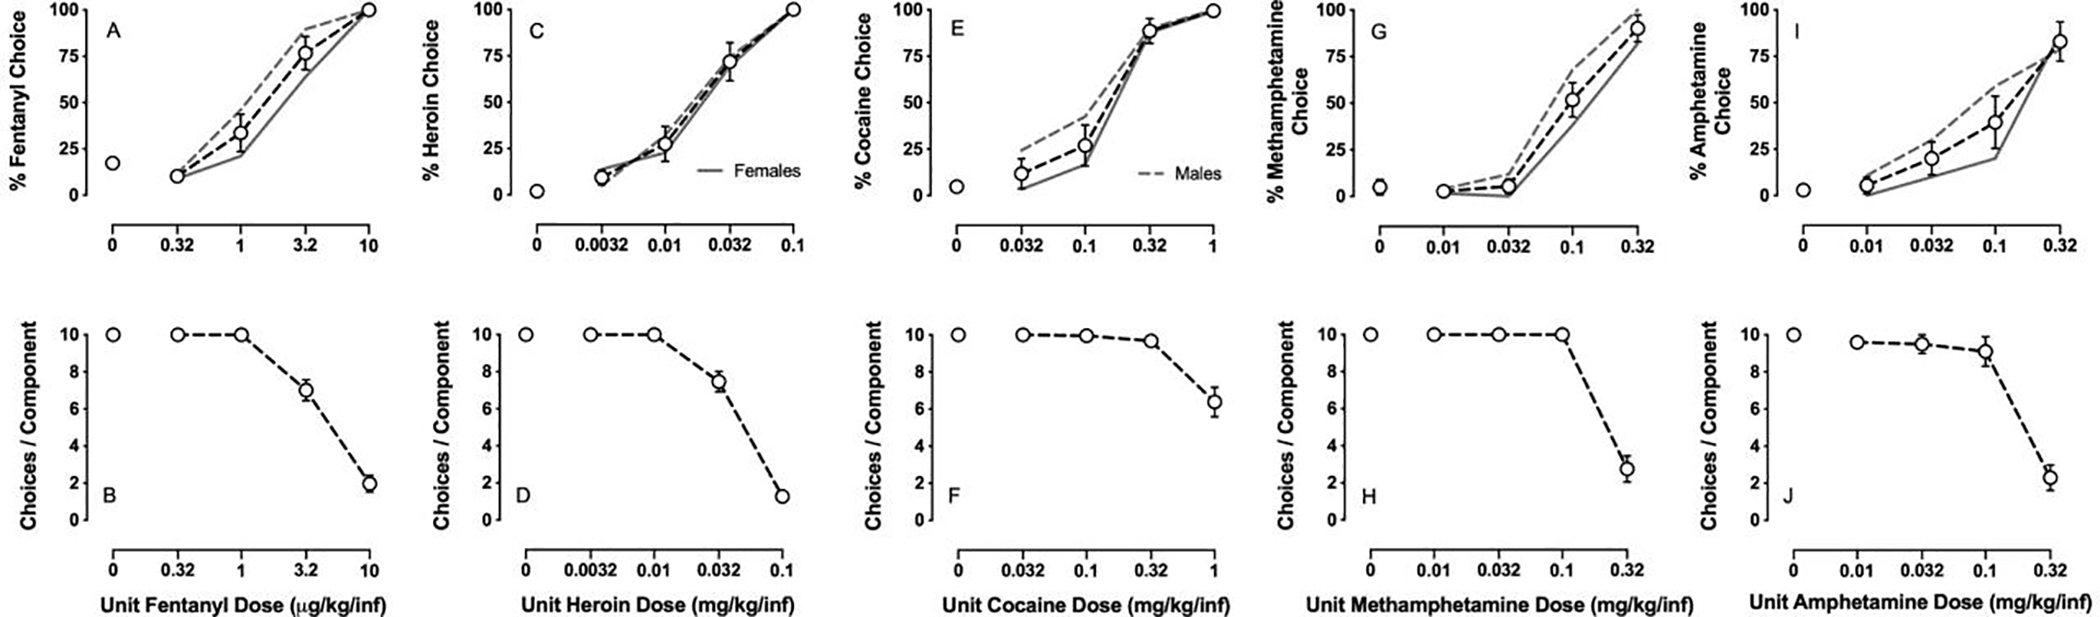
Demonstration of intravenous (IV) drug-vs-food choice with (A, B) fentanyl, (C, D) heroin, (E, F) cocaine, (G, H) methamphetamine, and (I, J) amphetamine in male and female rats. Top panels show percent drug choice as a function of unit drug dose in either micrograms or milligrams per kilogram per infusion. Bottom panels show the number of choices completed per component as a function of the unit dose drug available as the alternative to liquid food (18% for fentanyl and methamphetamine; 18 and 32% for heroin; 32% for cocaine and amphetamine). All points represent the mean ± s.e.m. of the follow group sizes: fentanyl (12 rats); heroin (12 rats); cocaine (10 rats); methamphetamine (12 rats); amphetamine (9 rats). Dashed gray line shows mean data from males whereas solid gray line shows mean data from females.