


Fig. 3 |. AP-1 pioneer tF bookmarking of the senescence enhancer landscape foreshadows the senescence transcriptional programme.
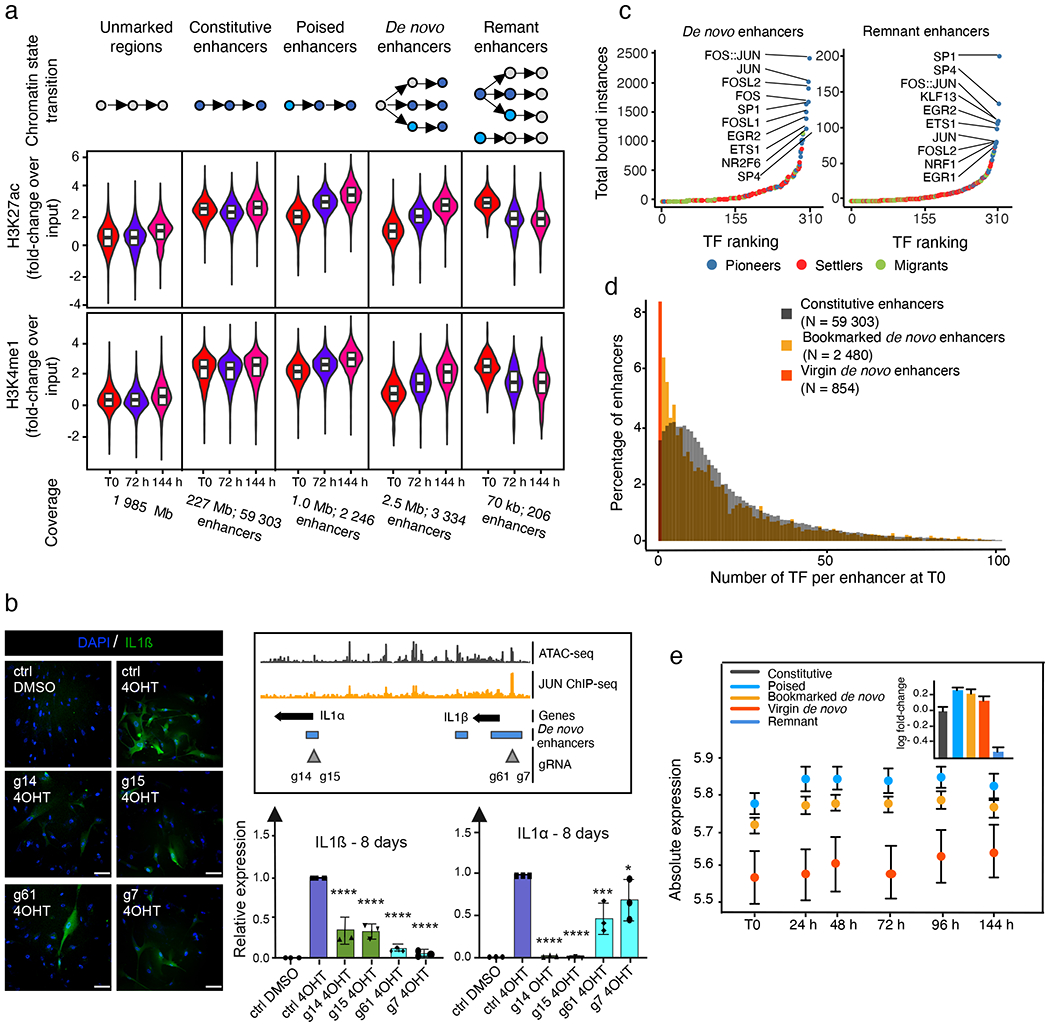
a, Distribution of the FC in normalized enhancer marks H3K27ac and H3K4me1 ChIP-seq signals over input in genomic bins flagged as unmarked regions, constitutive enhancers, poised enhancers, de novo enhancers and remnant enhancers at indicated time points during RAS-OIS in WI-38 fibroblasts. Text underneath the chart specifies the genomic coverage in mega bases (Mb) for each category and the corresponding number of enhancers. Chromatin states were defined from two biologically independent experiments. Violin plots depict the average distribution of ChIP-seq signals over input across biological replicates. Centre lines depict the medians, and the lower and upper edges correspond to the first and third quartiles, respectively. b, WI-38-ER:RASv12 fibroblasts were super-infected with dCas9-KRAB and individual gRNAs (g14, 15, g61 and g7) targeting two de novo enhancers. Cells were pharmacologically selected and induced into RAS-OIS by 4-OHT. Eight days after RAS-OIS induction, cells were stained by indirect immunofluorescence for IL-1β (left) or analysed by RT-qPCR for IL1A and IL1B expression (lower right). Data represent the mean ± s.d. (n = 3 biologically independent experiments). *P = 0.0440, ***P = 0.0009, ****P < 0.0001. Comparison with control (Ctrl) 4-OHT, one-way ANOVA (one-sided Dunnett’s test). Scale bars, 100 μm. DMSO, dimethylsulfoxide. c, Rank plot depicting the summed occurrences for TF binding in de novo enhancers before RAS-OIS induction (left) and remnant enhancers after RAS-OIS induction (144 h) (right) in WI-38 fibroblasts. The top ten TFs are indicated. d, Distribution of total number (N) of TFs bound per enhancer for constitutive enhancers, bookmarked de novo enhancers and virgin de novo enhancers. e, The average absolute expression level log2 scale) kinetics for genes associated with poised, TF bookmarked de novo and TF virgin de novo enhancers. Circles depict the average absolute expression level, and bars depict the s.e.m. The inset histogram illustrates the average leading log2(FC) in expression (±s.e.m.) for genes associated with constitutive, poised, TF bookmarked de novo, TF virgin de novo and remnant enhancers collected from two biologically independent time series. Source data are provided.