


Figure 2.
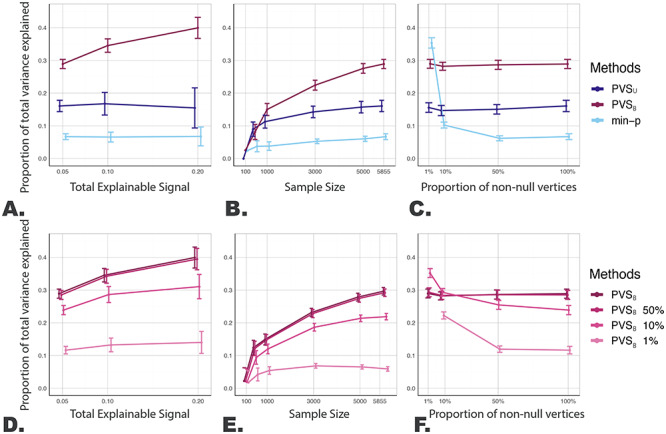
The PVSB demonstrated superior predictive performance compared with the PVSU, and min-P (A–C) as well as its thresholded variants (D–F) across various simulated conditions. Figure 2 showed the mean and 1.96 standard deviation confidence interval of the proportion of total variance explained by each method. The advantage of the PVSB over the PVSU and the min-P was most prominent at higher levels of total explainable signal (A), larger sample size (B), and with increased proportion of non-null vertices (C). When the true signal structure was nonsparse, (10, 50, and 100% of non-null vertices; C), the advantage in prediction accuracy of the PVSB was prominent, manifested by its superior, prediction performance compared with the PVSU and min-P. Superior predictive performance was established for the PVSB compared with its thresholded variants (D, E). When the true signal structure was global, the PVSB outperformed its thresholded variants across levels of total explainable signals (D) and across sample sizes (E). Sensitivity to the underlying signal structure of the PVSB was estimated with varying simulated levels of signal sparsity (F): when the true signal structure was sparse, that is, the proportion of non-null vertices was small, the thresholded PVSB at the corresponding level of statistical threshold outperformed the unthresholded PVSB, highlighting the sensitivity of the PVSB to the underlying signal structure of the simulated brain-behavior association. The complete simulation results were reported in Supplementary Material.