


Figure 3: Astrocyte Gi-GPCR pathway activation corrected astrocyte alterations in HD mice.
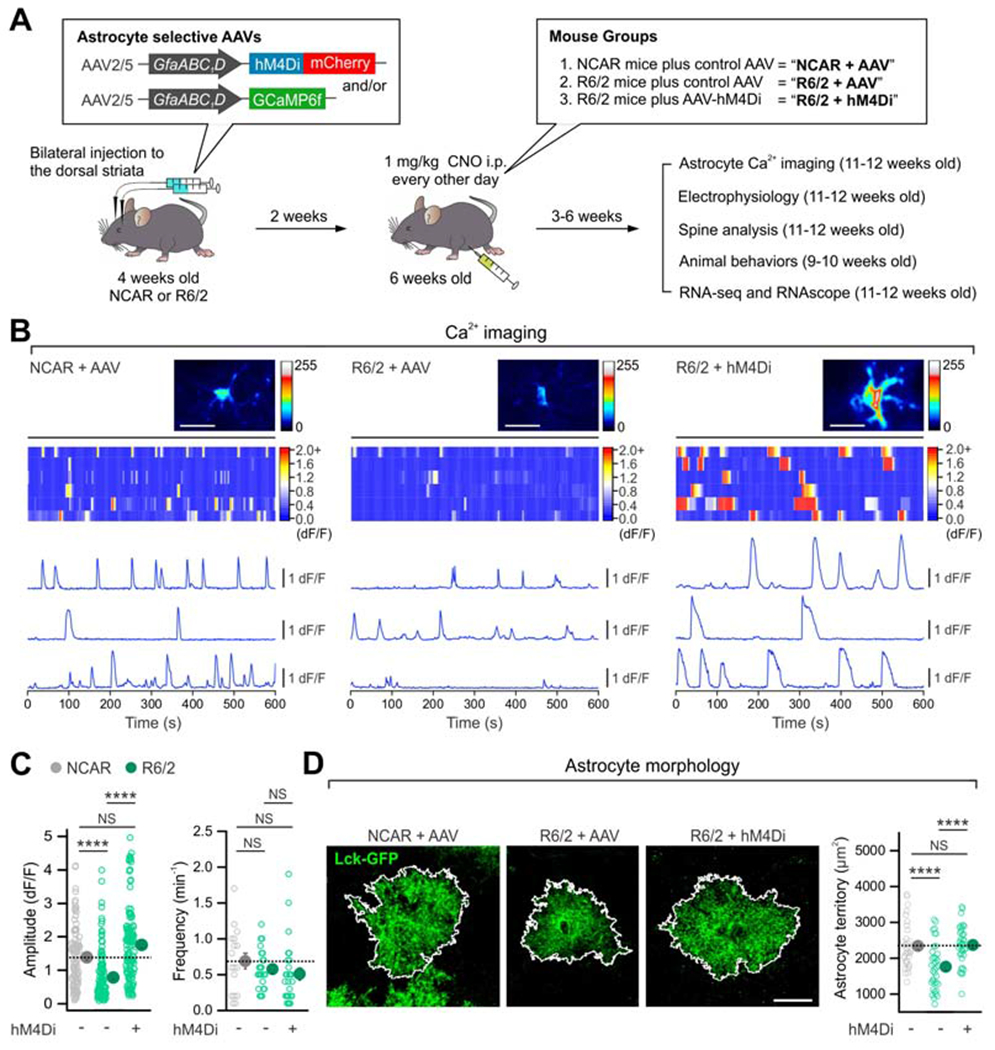
(A) Schematic of experimental design. (B) Maximum intensity projection images, kymographs and ΔF/F traces of astrocyte intracellular Ca2+ signals from indicated groups. (C) The reduced peak amplitude of astrocyte Ca2+ signals in R6/2 mice was rescued with hM4Di activation (left). The frequency of Ca2+ signals was not different between the groups (right). n = 111-138 Ca2+ events from 18-27 astrocytes from 4 mice. (D) hM4Di activation in striatal astrocytes increased the territory size of Lck-GFP-expressing striatal astrocytes in R6/2 mice (n = 33-37 astrocytes from 4 mice per group). Scale bars: 20 μm. Data are shown as mean ± SEM. In some cases, the SEM symbol is smaller than the symbol for the mean. Full details of n numbers, precise P values and statistical tests and raw values are reported in Excel files S3 and S4. **** indicates P < 0.0001, NS indicates not significantly different.