


Fig. 3.
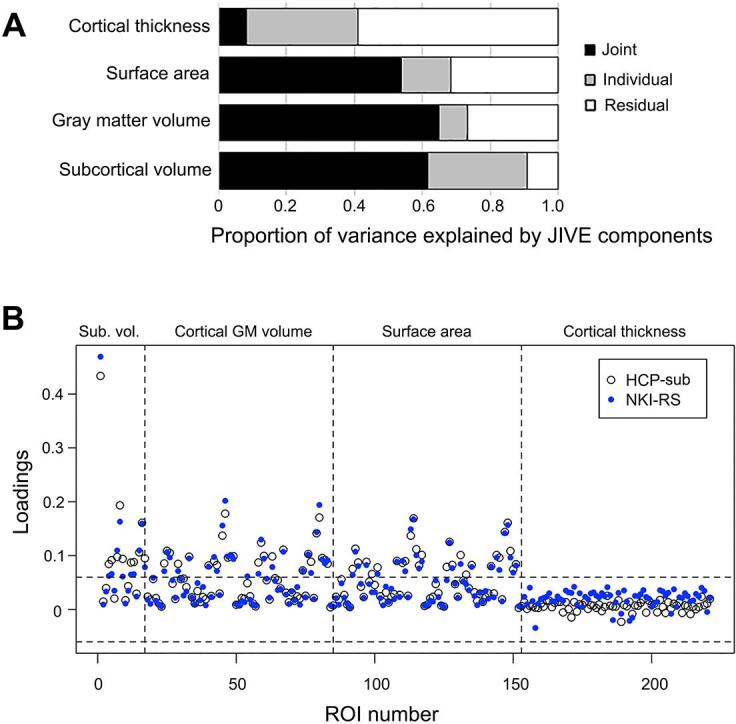
A highly similar joint component exists in the NKI-RS data (shown in blue) as identified in the HCP subsample data. (A) Proportion of variance explained by JIVE components in the NKI-RS data. See Fig. 1 for proportion of variance explained by JIVE components in the HCP subsample data. (B) Overlayed scatter plot of the loadings for 221 ROI structural features in the joint components derived from the HCP subsample (HCP-sub) and the NKI-RS data sets. (For interpretation of the references to colour in this figure legend, the reader is referred to the web version of this article.)