


Figure 3. Trajectory analysis of scRNA-seq data supports alternative origins for ATOH1-dependent and -independent tuft cells.
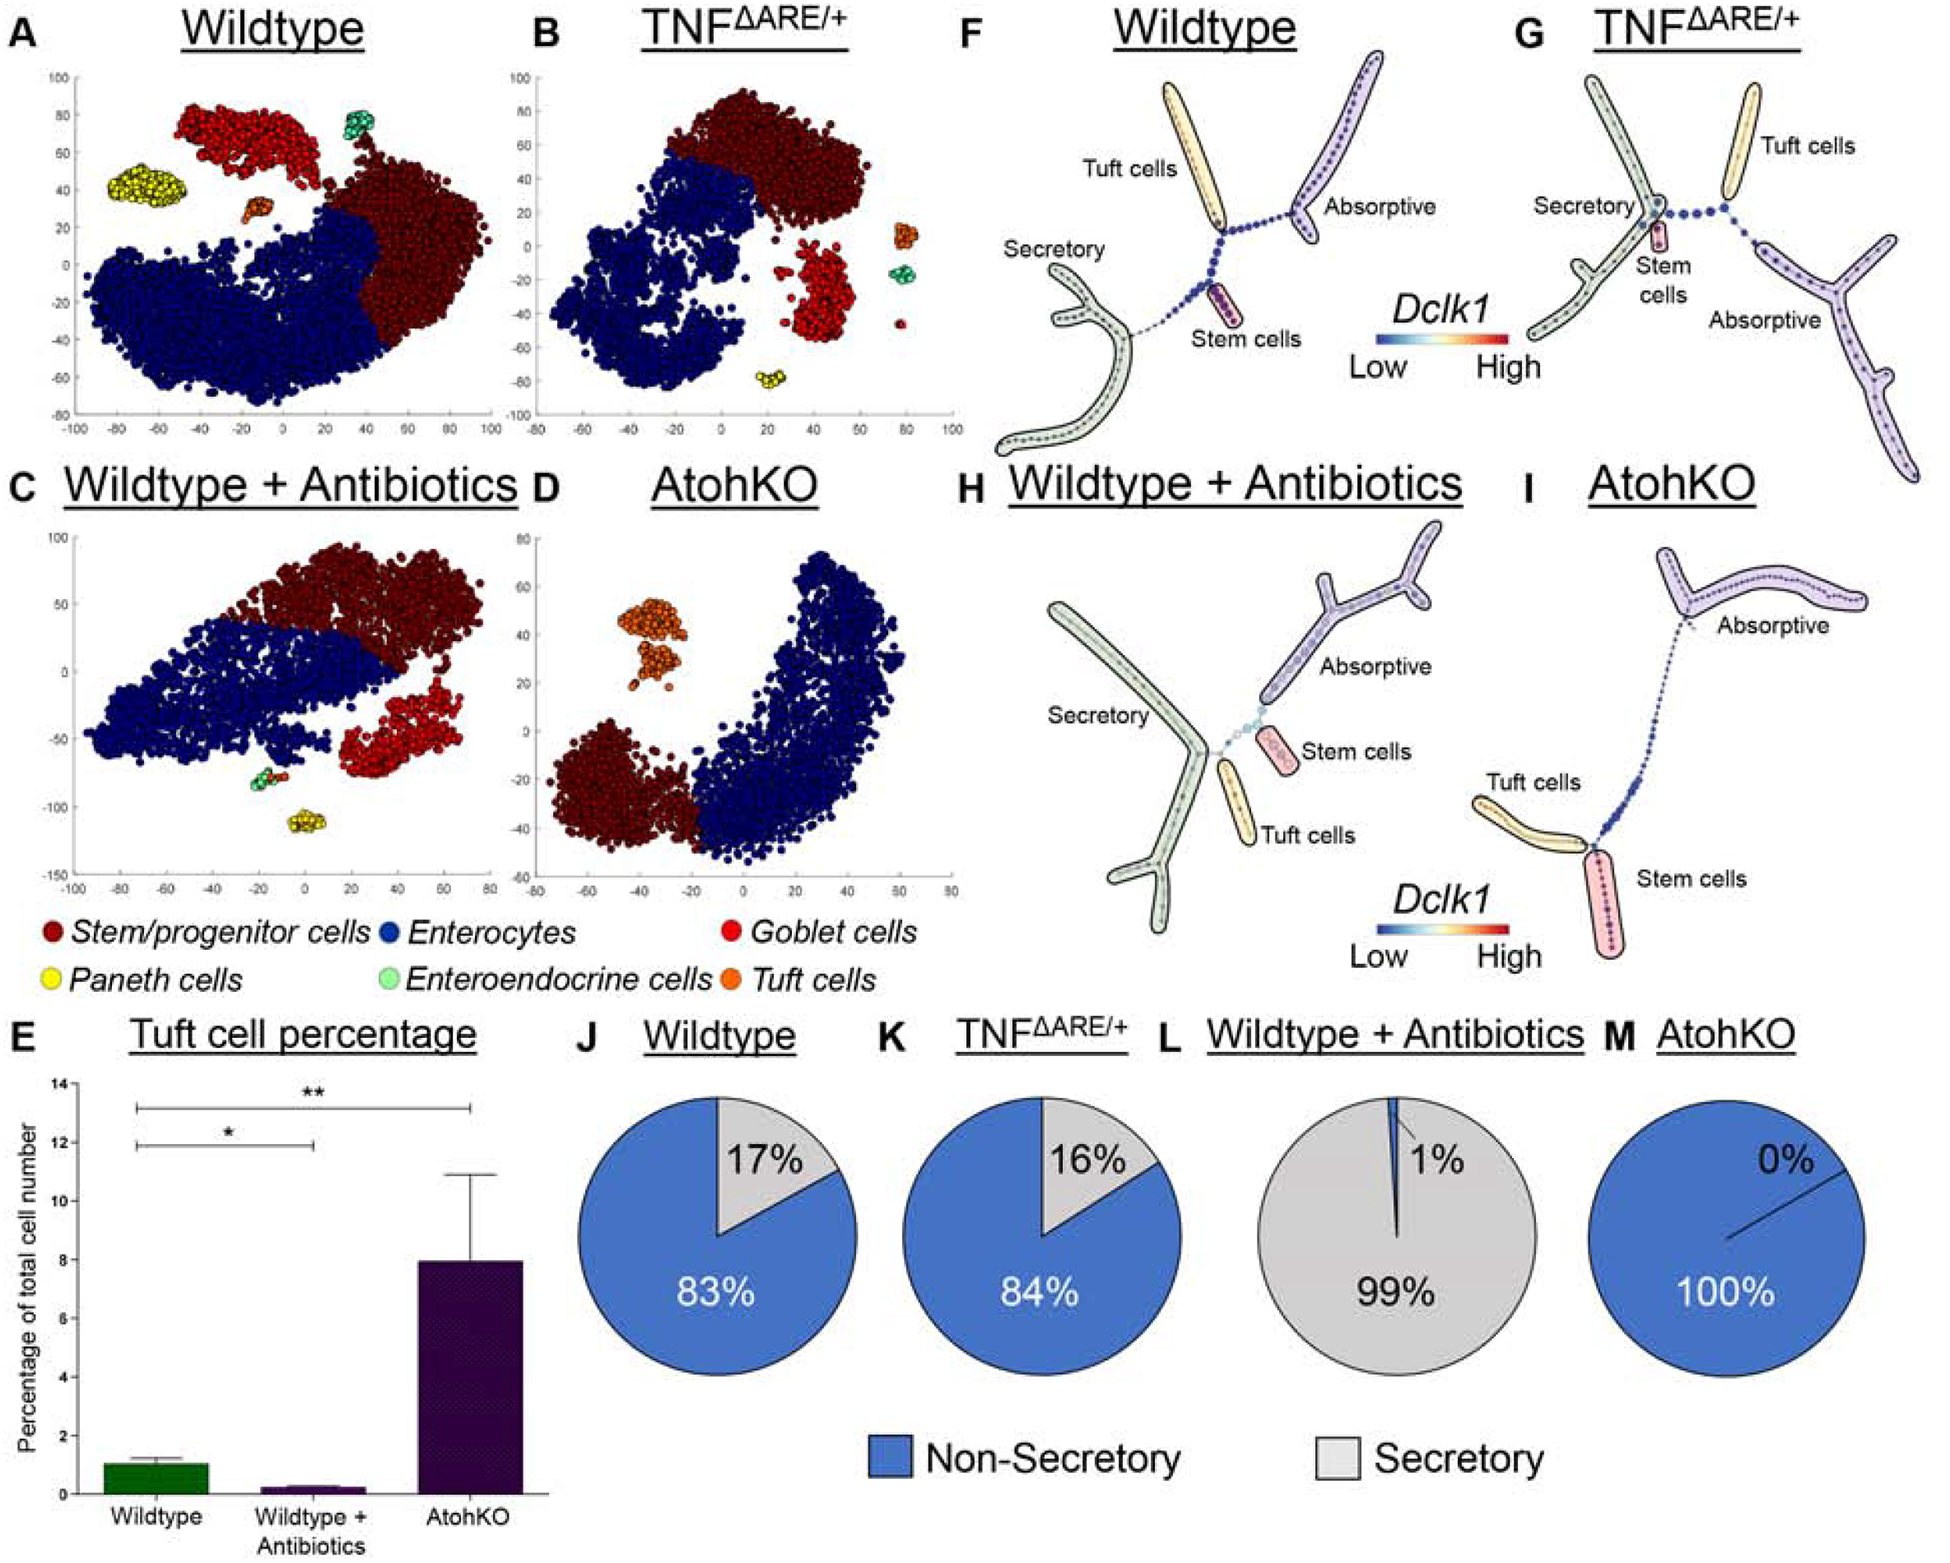
(A-D) t-SNE analysis of scRNA-seq data generated from different murine models annotated with cell type cluster. n = 6 wildtype, 3 TNFΔARE/+, 2 antibiotic-treated wildtype, 3 AtohKO. (E) Tuft cell percentage quantification from scRNA-seq. SEM for replicates plotted. (F-I) Top scoring p-Creode topologies of scRNA-seq data with lineage annotation. Node size represents cell state density. (J-M) Quantification of n = 100 p-Creode topology maps for either non-secretory or secretory tuft cell placement. p-value * < 0.05, ** < 0.01.