


Figure 3: Bayesian inference reveals associations between the microbiota and dynamics of circulatory white blood cell counts.
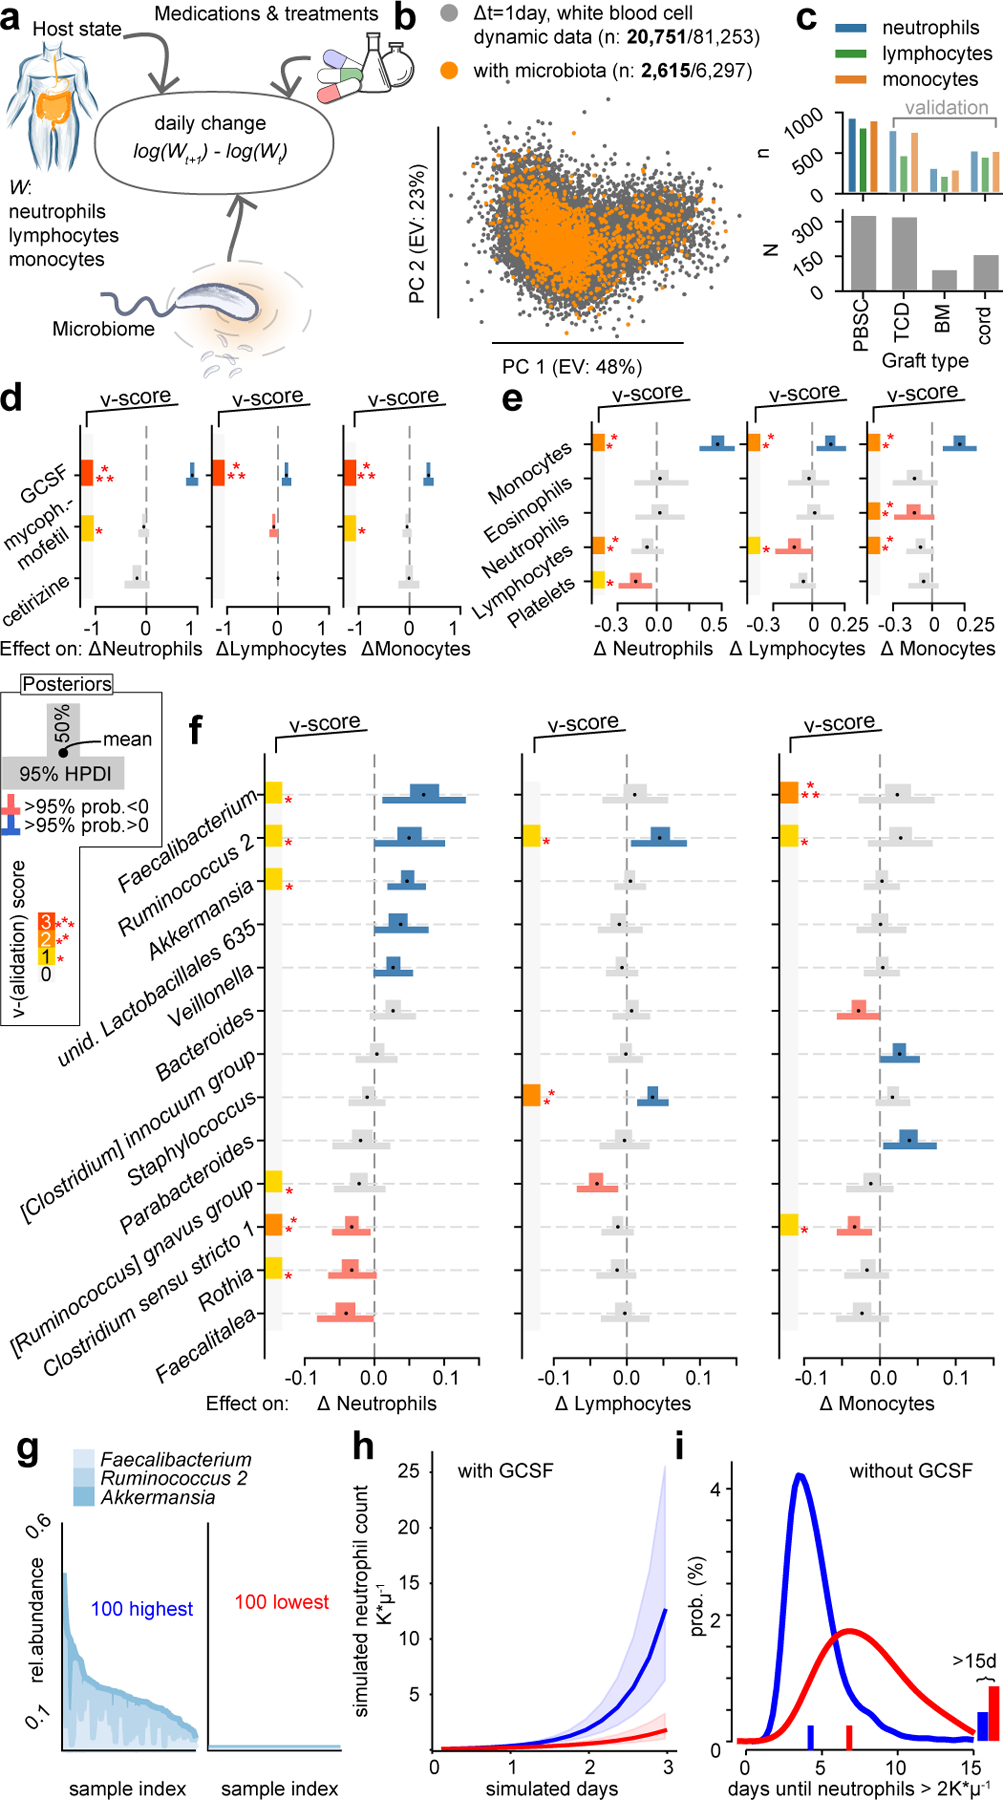
a Cartoon of the model: observed changes in WBC counts between two consecutive days are associated with the current state of the host in the form of blood cell counts in circulation, immunomodulatory medications, clinical metadata, and the state of the microbiome. b Visualization of the data of WBC dynamics; scatter plot of the principal components (PC) of observed daily changes of neutrophils, lymphocytes and monocytes without (grey) and with (orange) available concurrent microbiota samples (bold: post neutrophil-engraftment samples). c PBSC patients (N=312) provided most paired blood dynamics and microbiota samples (n=995); TCD, BM and cord patient data sets were used for validation. d-f Bayesian inference results from PBSC patient data; posterior coefficient distributions of associations between treatments (d), WBC counts (e), and log10-relative abundances of microbial genera (f) and daily changes in neutrophils, lymphocytes and monocytes. v-score: number of validation cohorts confirming associations, set to zero if invalidated by validation cohorts (additional coefficients in Extended Data Fig. 4a–c). g 100 microbiota samples with highest (left) or lowest (right) abundances of Faecalibacterium, Ruminococcus 2 and Akkermansia. h Simulation of neutrophil dynamics in presence of GCSF and microbiota compositions sampled either from those high (blue) or low (red) in Faecalibacterium, Ruminococcus 2 and Akkermansia relative abundance as shown in g); line: median of 1,000 simulations, shaded regions: interquartile range of simulated trajectories. i Time until neutrophil counts first reach >2K*μl−1 in equivalent simulations without GCSF.