


Fig. 6. Experimental analysis demonstrates the potential of using the models to fine-tune gene expression.
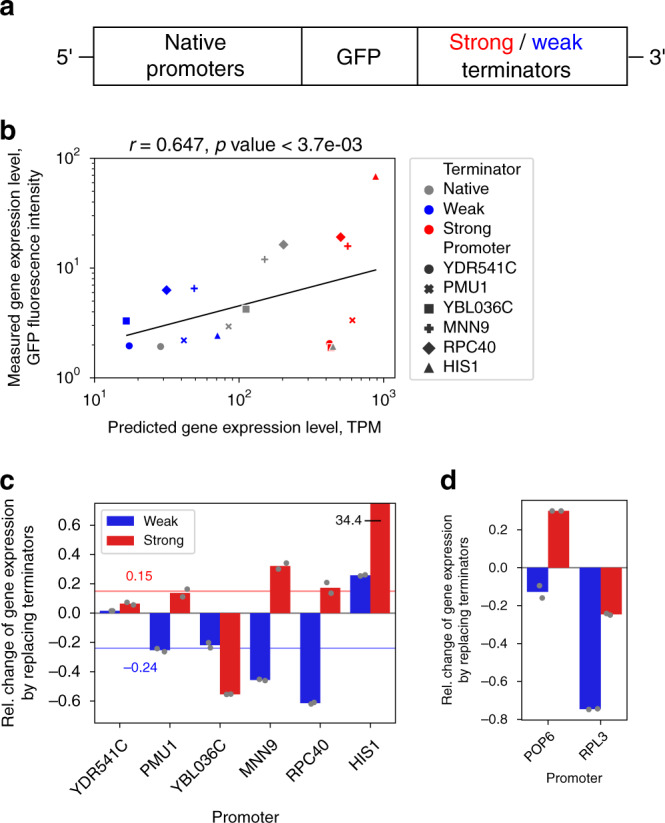
a Conceptual diagram of experiment and constructs. b Correlation analysis between model predictions and measured GFP fluorescence levels for constructs with 6 promoters in combination with native (grey) as well as strong (red) and weak (blue) terminators (n = 18). Black line denotes least squares fit. c Relative change in measured GFP fluorescence levels of the constructs, where native terminators were replaced with either strong (red bars) or weak (blue bars) variants with n = 2 technical replicates indicated as grey points (see text and Supplementary Table 13). On average, the GFP fluorescence levels shifted by 20% in the directions of the predicted levels. Red and blue lines denote median values with strong and weak promoters, respectively. d Additional tests with the weak POP6 and strong RPL3 promoters, whose CDS were more dissimilar to GFP. Native terminators were replaced with either strong (red bars) or weak (blue bars) variants with n = 2 technical replicates indicated as grey points. Source data are provided as a Source data file.