


Fig. 2. Development and validation of CytoTRACE.
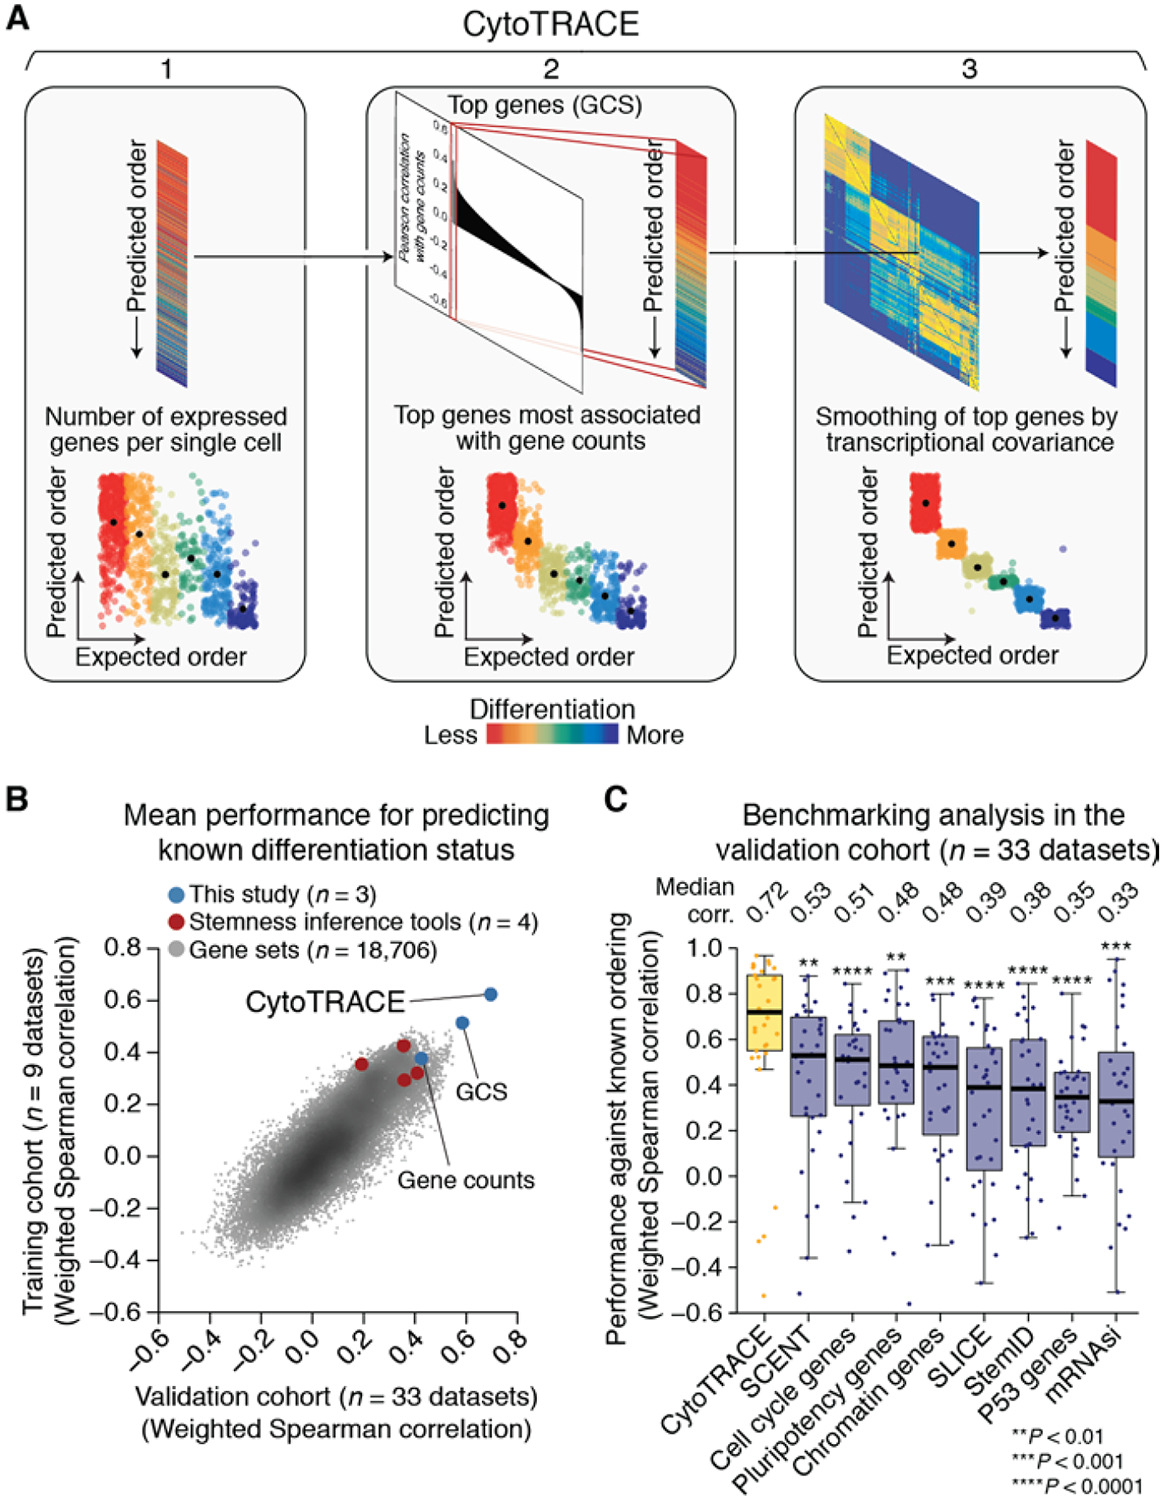
(A) Schematic overview of the CytoTRACE framework applied to the hESC in vitro differentiation (C1) dataset (materials and methods and table S1). (B) Scatterplot comparing the average performance of 18,706 annotated gene sets, four stemness inference methods, gene counts, GCS, and CytoTRACE in the training and validation cohorts (table S2). (C) Boxplots showing the single-cell performance of CytoTRACE against RNA-based features and methods in the validation cohort (n = 33 datasets; table S2). Each point represents the Spearman correlation, weighted by number of cells per phenotype, between predicted and known differentiation states for a given dataset, calculated as described in materials and methods. Statistical significance was assessed by a one-sided paired Wilcoxon signed-rank test against CytoTRACE (table S4).