


Fig. 8. Projected PK and PD of selinexor therapy.
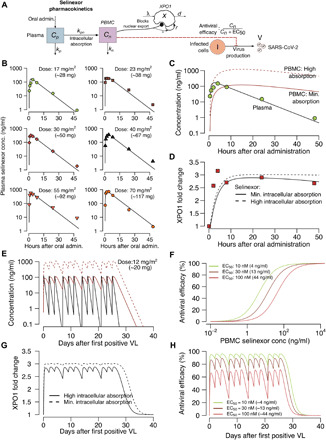
(A) Complete model of selinexor including plasma levels, PBMC levels, inhibition of XPO1-mediated cellular export of viral proteins, and inhibition of viral replication in a dose-dependent fashion. (B) Single-dose model drug levels (line) reproduce observed data points at different doses. (C) Projected PBMC levels assuming low and high selinexor absorption rates. (D) Predicted fold change in compensatory XPO1 mRNA expression after a single dose with model fits to data. (E) Projected plasma (black) and PBMC (red; dashed = high absorption and solid = low absorption) selinexor levels with three times weekly dosing for 4 weeks. (F) PD projections of antiviral efficacy according to drug concentration assuming different values for the in vivo EC50 of the drug. (G) Predicted fold change in compensatory XPO1 mRNA expression after multiple doses. (H) Projected antiviral effects using combined PK and PD models at different assumed drug potencies.