


Fig. 4 |. In vivo 2-photon imaging of DA dynamics in Drosophila using GRABDA sensors.
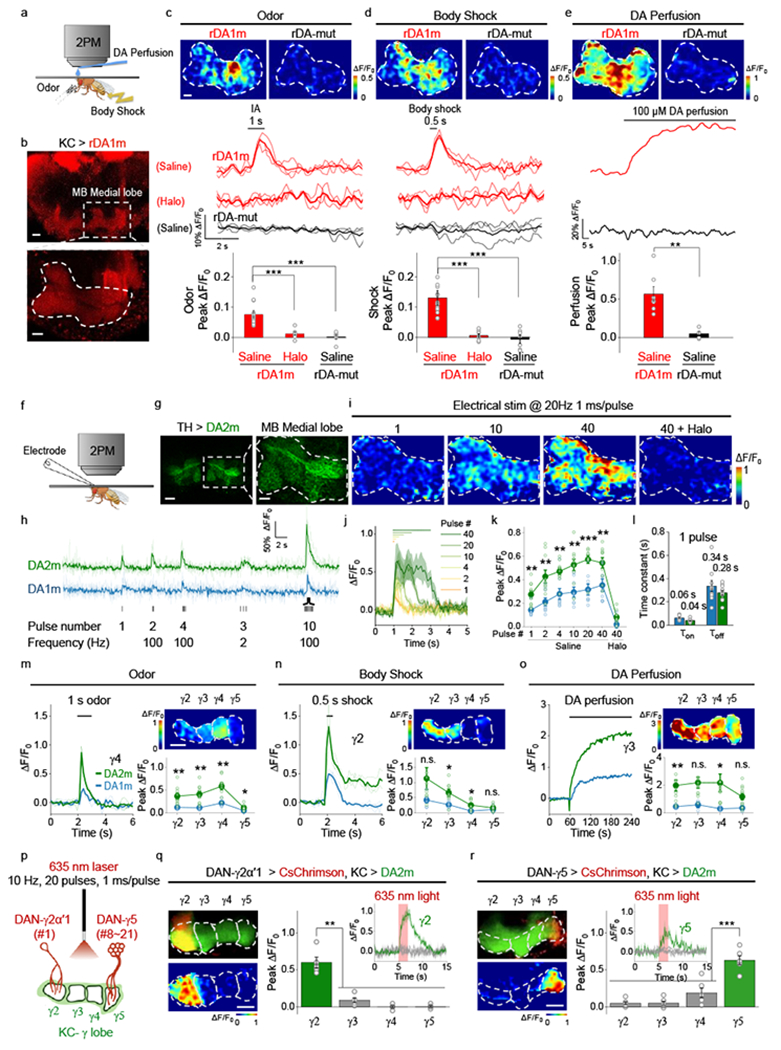
a, Schematic illustration depicting the experimental setup for imaging fluorescence changes in response to various stimuli.
b, Representative fluorescence images of rDA1m expressed in Kenyon cells (KCs), with an expanded view of the olfactory mushroom body (MB) medial lobe. Similar results were observed for 15 flies. Scale bars, 20 µm (top) and 10 µm (bottom).
c-e, Representative images (top; the dashed area indicates the MB medial lobe), traces (center), and group summary (bottom) of ΔF/F0 in response to odorant (c), body shock (d), and DA perfusion (e). Scale bar, 10 µm. c, n=15, 7, 6 flies for rDA1m (saline), rDA1m (Halo), rDA-mut. d, n=15, 7, 8 flies for rDA1m (saline), rDA1m (Halo), rDA-mut (saline). e, n=7, 5 flies for rDA1m (saline), rDA-mut (saline). Two-tailed Student’s t-test was performed. c, p=0.0002 (***) between rDA1m (saline) and rDA1m (Halo); p=6.70×10⁻⁶ (***) between rDA1m (saline) and rDA-mut (Saline). d, p=5.48×10⁻⁵ (***) between rDA1m (saline) and rDA1m (Halo); p=1.71×10⁻⁶ (***) between rDA1m (saline) and rDA-mut (Saline). e, p=0.0016 (**) between rDA1m (saline) and rDA-mut (Saline).
f, Schematic illustration depicting the experimental setup for imaging electrical stimulation–evoked DA release.
g, Representative fluorescence images of DA2m expressed in dopaminergic neurons (DANs), with an expanded view of the MB medial lobe. Similar results were observed for 10 flies. Scale bars, 20 μm (left) and 10 μm (right).
h, Representative traces of DA2m and DA1m fluorescence; where indicated, electrical stimuli were applied.
i,j, Representative images (i) and traces (j) of DA2m ΔF/F0 in response to electrical stimuli. Similar results were observed for 10 flies.
k, Group summary of DA2m and DA1m ΔF/F0 in response to electrical stimuli. n=9, 5, 10, 10 flies for DA1m (saline), DA1m (Halo), DA2m (saline), DA2m (Halo). Two-tailed Student’s t-test was performed. p=0.0023 (**), 0.0047 (**), 0.0025 (**), 0.0014 (**), 0.0002 (***), 0.0091 (**) for 1, 2, 4, 10, 20, 40 pulse(s), respectively.
l, Kinetics (τon and τoff) of DA2m and DA1m in response to a single electrical stimulus. n=9, 10 flies for DA1m, DA2m.
m-o, Representative traces (left), fluorescence images (top right), and group summary (bottom right) of the indicated MB lobe compartments in response to odorant (m), body shock (n), and 1mM DA perfusion (o). m, n= 4, 9 flies for DA1m, DA2m. n, n=6, 8 flies for DA1m, DA2m. o, n=3, 11 flies for DA1m, DA2m. Two-tailed Student’s t-test was performed. m, p=0.0070 (**), 0.0024 (**), 0.0091 (**), 0.0171 (*) for γ2, γ3, γ4, γ5. n, p=0.0910 (n.s.), 0.0137 (*), 0.0207 (*), 0.3808 (n.s.) for γ2, γ3, γ4, γ5. o, p= 0.0033 (**), 0.0701 (n.s.), 0.0150 (*), 0.0990 (n.s.) for γ2, γ3, γ4, γ5.
p, Schematic illustration depicting the strategy for imaging optogenetically induced DA release. DA2m is expressed in the KCs, and CsChrimson is expressed in the DANs in either the γ2 or γ5 MB compartment (with the number of innervating cells indicated).
q,r, Representative fluorescence images (top left), response images (bottom left), representative traces (top right), and group summary (bottom right) of DA2m fluorescence in the γ2 (q) and γ5 (r) MB compartments in response to optogenetic stimulation. Scale bars, 20 μm. q, n=5 flies. r, n=6 flies. Two-tailed Student’s t-test was performed. q, p=0.0035 (**), 0.0012 (**), 0.0013 (**) between γ2 and γ3, γ4, γ5. r, p=0.0002 (***), 0.0003 (***), 0.0001 (***) between γ5 and γ2, γ3, γ4.
The group data for DA1m shown in panels k, m, n, and o were reproduced from Sun et al.11 with permission. Average traces (bold), overlaid with single-trial traces (light) from one fly are shown for representation in c, d, h, m, n. Average traces shaded with ± s.e.m. from one fly are shown for representation in j, q, r. Data are presented as the mean ± s.e.m. in c, d, e, k, l, m, n, o, q, r.