


Figure 7. Inhibition of cholesterol biosynthesis with statins promotes basal PDAC development.
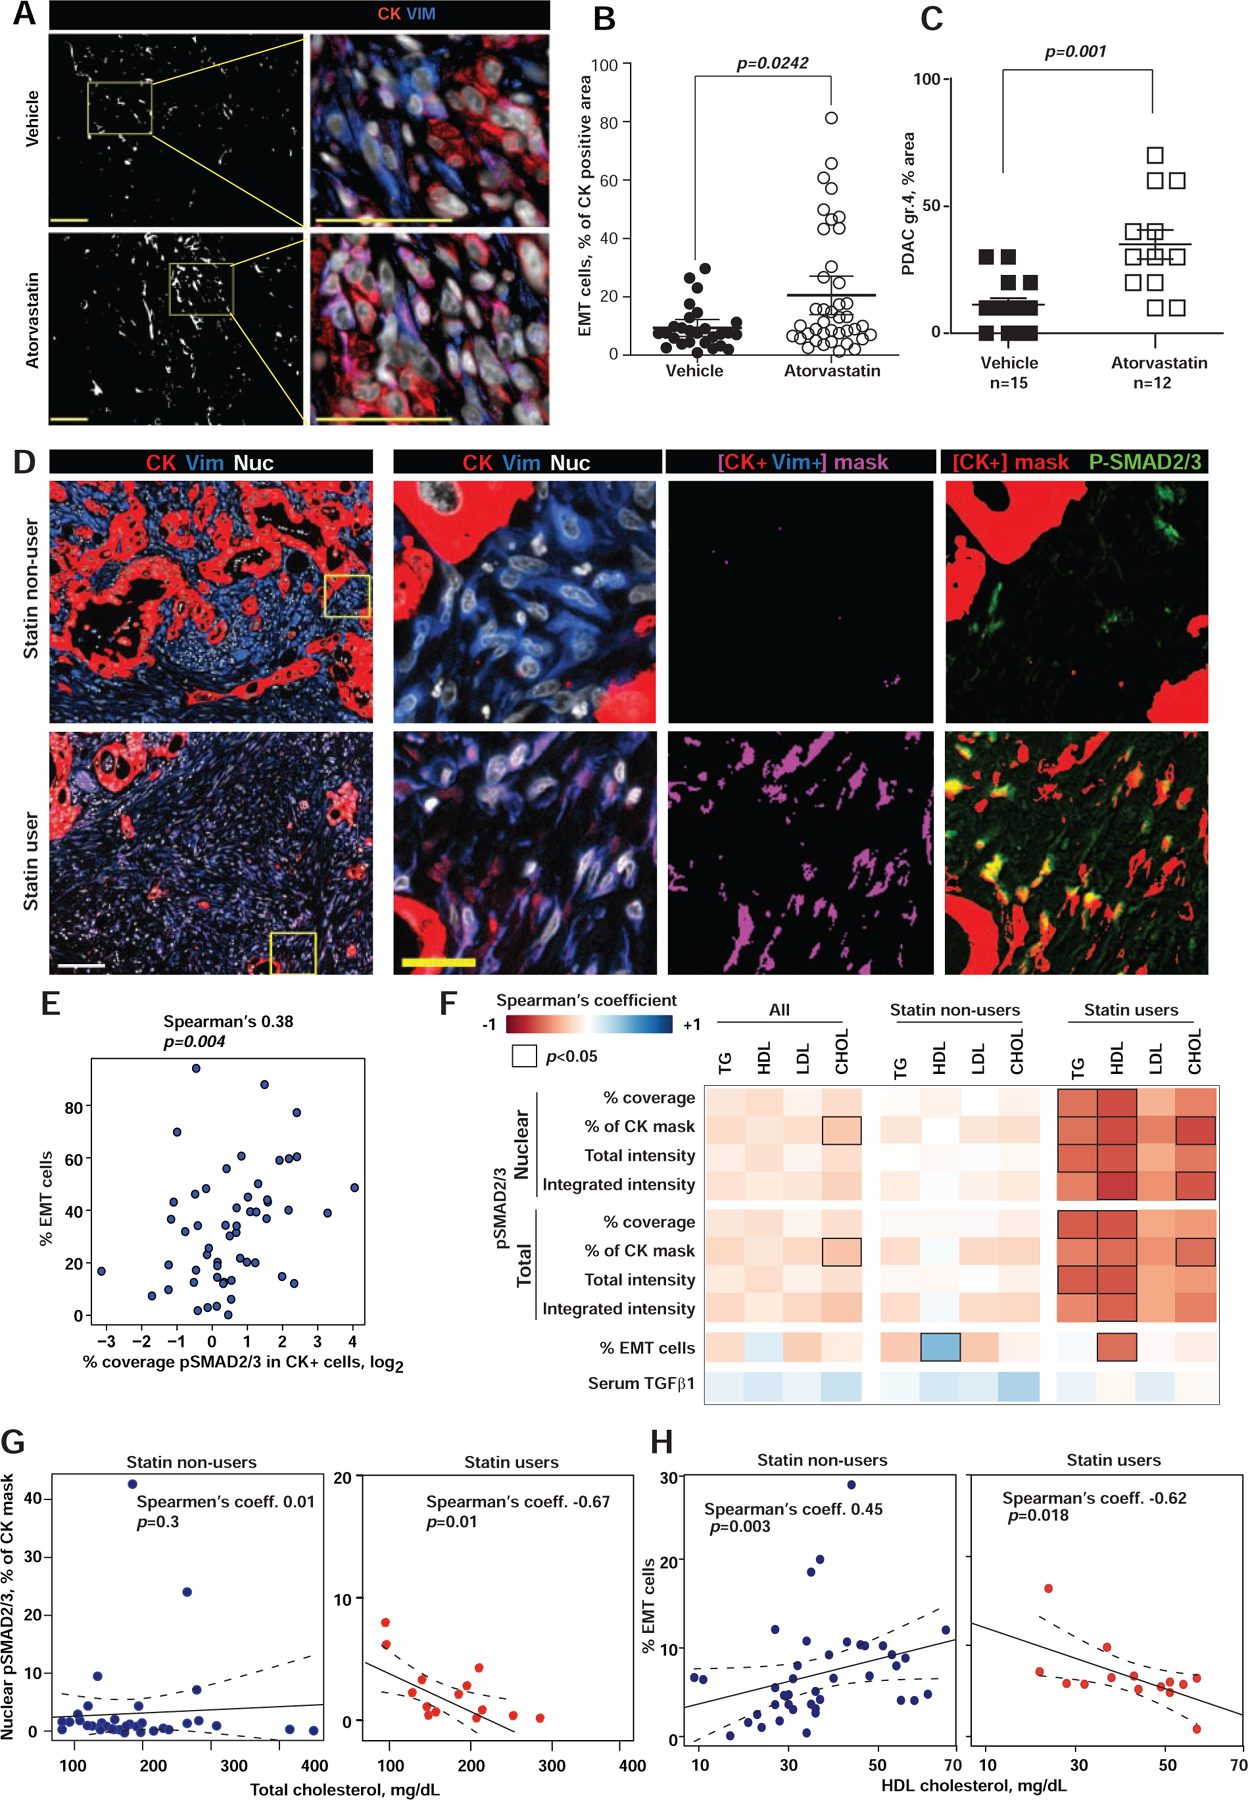
(A) Epithelial (cytokeratin, CK, red) and mesenchymal (vimentin, VIM, blue) compartments in murine pancreatic KPPC tumors. Digital mask in white corresponds to CK+/Vim+ areas, used to quantify EMT cells (magenta). Nuclei are in gray. Scale bars = 100 μm. (B) Graph shows EMT areas (dot represent single images). (C) Percent area with grade 4 PDAC in KPPC mice treated with atorvastatin (open symbols) or vehicle (closed symbols). (D) From left to right, first column shows Epithelial (CK, red), mesenchymal (VIM, blue) and nuclei (grey) compartments in human PDAC tissue. The following three columns correspond to magnifications of the yellow boxed regions. Third column depicts EMT areas (i.e., CK+/Vim+ in magenta masks). Last column includes CK+ masks in red, which were overplayed with immunofluorescent pSMAD2/3 (Green) to highlight co-localization areas (yellow). Scale bars: white=100 μm, yellow=25 μm. (E) Spearman’s correlations of pSMAD2/3 and the percent of CK+/VIM+ cells (EMT-PDAC cells). (F) Heat map of Spearman’s correlation coefficient for nuclear and total pSMAD2/3 and serum lipids, correlations with p<0.05 are outlined. (G, H) Correlation of total serum cholesterol with nuclear pSMAD2/3 expression in PDAC cells (G) and percent of EMT-PDAC cells (H) in statin users. In figures B and C, data are represented as mean±SEM, p-values determined by Mann-Whitney test with indicated p-values. See also Figure S7.