



Abstract
Deregulation of metabolism and disruption of genome integrity are hallmarks of cancer1. Elevated levels of the metabolites, 2-hydroxyglutarate (2HG), succinate, and fumarate, occur in human malignancies due to somatic mutations in the isocitrate dehydrogenase-1/2 (IDH1/2) genes or germline mutations in the fumarate hydratase (FH) and succinate dehydrogenase (SDH) genes, respectively2–4. Recent work has made an unexpected connection between these metabolites and DNA repair by showing that they suppress the pathway of homology-dependent repair (HDR)5,6 and confer an exquisite sensitivity to poly (ADP-ribose) polymerase (PARP) inhibitors that is being tested in clinical trials. However, the mechanism by which these oncometabolites inhibit HDR remains poorly understood. Here we elucidate the pathway by which these metabolites disrupt DNA repair. We show that oncometabolite-induced inhibition of the lysine demethylase KDM4B results in aberrant hypermethylation of histone 3 lysine 9 (H3K9) at loci surrounding DNA breaks, masking a local H3K9 trimethylation signal that is essential for the proper execution of HDR. Consequently, recruitment of Tip60 and ATM, two key proximal HDR factors, is significantly impaired at DNA breaks, with reduced end-resection and diminished recruitment of downstream repair factors. These findings provide a mechanistic basis for oncometabolite-induced HDR suppression and may guide effective strategies to exploit these defects for therapeutic gain.
2HG, succinate, and fumarate inhibit α-ketoglutarate (αKG)-dependent dioxygenases7,8 including histone lysine demethylases and other epigenetic modifiers9–11. We initially identified two lysine demethylases, KDM4A and KDM4B, as potential targets for oncometabolite suppression of HDR in an initial screen5. To further investigate this, we assembled a series of human cancer cell lines with endogenous and engineered IDH1/2, FH, and SDH mutations, shRNA knockdowns, and CRISPR modifications and confirmed the expected levels of oncometabolites and the corresponding hypermethylation of histone 3 lysine 9 (H3K9; a target for demethylation by KDM4A and KDM4B) (Extended Data Fig. 1a–h).
Based on the capacity of KDM4A/B to regulate gene expression11,12, we considered that 2HG, fumarate, and succinate might suppress HDR via gene downregulation. Transcriptome analyses comparing IDH1 R132H/+ cells to WT cells showed broad changes in gene expression (Extended Data Fig. 1i), but no correlation of IDH1 status with HDR genes (Extended Data Fig. 1j). Gene expression patterns in human gliomas in the TCGA Lower Grade Glioma cohort indicated that HDR genes are not suppressed in mutant IDH tumors (Extended Data Fig. 1k). Western blot analyses of isogenic cell lines with or without R132H mIDH1 or FH or SDH shRNA knockdown showed no differences in the HDR factors, RAD51, BRCA2, ATM, Tip60, MRE11, or RPA (Extended Data Fig. 1l).
Alternatively, we tested for a direct functional effect on HDR. We observed elevated double-strand breaks (DSBs), characteristic of HDR deficient cells5,6, as early as 2 h after addition of either 2HG, fumarate, or succinate to cells (Fig. 1a, Extended Data Fig. 1m,n). We confirmed that intracellular levels of the metabolites were elevated at the 2 h time-point as was H3K9me3, indicating KDM4A/B inhibition (Extended Data Fig. 1o–t). Such rapid kinetics pointed to a direct effect of the metabolites on HDR rather than on gene expression.
Figure 1. Oncometabolites directly suppress HDR.

(a) Quantification of neutral comet assays performed in immortalized astrocytes overexpressing WT IDH1 or IDH1 R132H or treated with 2HG, succinate or fumarate, and in YUNK1 cells after shRNA suppression of FH or SDHB or addition of 2HG, succinate or fumarate. (b) Quantification and (c) representative images of RAD51 nuclear foci at the indicated time-points after 2 Gy IR treatment in YUNK1 cells with shRNA suppression of FH or SDHB, or after pre-treatment with fumarate or succinate. Scale bar is 10 μm. (d) Quantification of cells with RAD51 foci positive nuclei in immortalized astrocytes overexpressing WT IDH1 or IDH1 R132H, and in HT1080 fibrosarcoma cells (IDH1 R132C/WT), and in HT1080 cells with a CRISPR/Cas9-mediated knockout of the IDH1 R132C allele (IDH1 KO/WT). Cells were treated with or without 2HG for 24 h, 1 μM AGI-5198 for 5 days or a combination thereof, before irradiation. For a and d, bars or lines represent mean +/− standard error with n=3 biological replicates and statistical analysis by two tailed, unpaired t-test, df=4. For b, line runs through the mean +/− SEM of 3 biological replicates with statistical analysis by ANOVA, with p values indicated.
We next examined DNA repair foci formation by RAD51 and BRCA1 in response to ionizing radiation (IR). In control cells, RAD51 foci are detectable at 2 h post-IR peaking at 4–6 h (Fig. 1b,c and Extended Data Fig. 2a,b), consistent with previous studies13. But RAD51 foci were attenuated in cells treated with fumarate or succinate and in cells with shFH or shSDH knockdown (Fig. 1b,c and Extended Data Fig. 2c,d,e). We also compared RAD51 foci in cells with or without mIDH1 or mIDH2 (including CRISPR/Cas9-mediated knockout of the endogenous IDH1R132C allele in HT1080 fibrosarcoma cells), with or without 2HG treatment, and with or without treatment with the mIDH1/2-specific inhibitors, AGI-5198 or AG-221. RAD51 foci formation was consistently impaired by elevated 2HG (Fig. 1d and Extended Data Fig. 2f,g). FH −/− UOK 262 human renal cell carcinoma cells showed low levels of RAD51 foci formation, but this was rescued by FH complementation, and then suppressed again when fumarate was added back (Fig. 1d). BRCA1 foci formation was similarly impaired by high levels of metabolites (Extended Data Fig. 2h–m). Consistent with HDR impairment, mIDH1 cells and tumors were radiosensitive compared to isogenic controls (Extended Data Fig. 2n–p).
Next, we developed a novel, ligand-dependent Double-Strand Break-Chromatin Immunoprecipitation (DSB-ChIP) assay (Fig. 2a) to monitor recruitment kinetics of HDR factors to a site-specific DSB. In this assay, a site-specific DSB is induced in U2OS DR-GFP cells14,15 (a human osteosarcoma cell line with a chromosomally integrated GFP-based HDR reporter) by a ligand-responsive I-SceI nuclease. The timing of DSB induction is precisely controlled in these cells, since addition of the ligands Shield-1 and triamcinolone rapidly causes I-SceI stabilization and nuclear localization, inducing the site-specific DSB within the DR-GFP reporter gene locus15 (Fig. 2a and Extended Data Fig. 3a).
Figure 2. Oncometabolites suppress the stepwise recruitment of HDR factors to DNA DSBs.

(a) Schematic representation of the DSB-ChIP assay system. (b) Heatmaps of the relative occupancy of the indicated factors at the site-directed DSB, as measured by ChIP, and normalized to the uninduced controls at the indicated time-points post addition of Shield-1 and triamcinolone. (c) DSB-ChIP quantification over time of H3K9me3 levels at the site-specific DSB. (d) Schematic representation of the PCR-based DNA end-resection assay. (e) Quantification of end-resection at the same site-specific DSB as used in the DSB-ChIP assay. (f) Immunofluorescence images of γH2AX and H3K9me3 in cell nuclei in the indicated cells without DNA damage or 1 min after laser micro-irradiation to induce DNA damage. Scale bars are 20 μm. (g) Quantification of Tip60 foci positive nuclei after IR in HT1080 fibrosarcoma cells, and in HT1080 cells with a CRISPR/Cas9-mediated knockout of the IDH1 R132C allele as well as in SNU1079 (IDH1 R132C/WT) and RBE (IDH1 R132S/WT) cholangiocarcinoma cells treated as indicated with or without 2HG for 24 h, 1 μM AGI-5198 for 5 days or a combination thereof, before IR. For e and g, bars or line represent mean +/− standard error with n=3 biological replicates and statistical analysis by two tailed, unpaired t-test, df=4. For c, line runs through the mean +/− SEM of 3 biological replicates with statistical analysis by ANOVA, with p values indicated.
Cells in the presence or absence of the respective metabolites were treated with Shield-1 and triamcinolone to rapidly induce the site-specific DSBs, and ChIP analyses were performed over time. Fig. 2b presents heat maps with the ChIP results normalized to uninduced cells at time zero for each respective antibody, with additional quantification in Extended Data Fig. 3b–l and antibody validation in Extended Data Fig. 3m–u). Phosphorylated γH2AX, a marker of DSBs, rapidly accumulated at the DSB in both control and metabolite-treated cells. However, the γH2AX signal resolved quickly in control cells but persisted in metabolite-treated cells, suggesting reduced repair. In control cells, we detected a rapid spike in H3K9 trimethylation at the DSB, occurring within 30 min after DSB induction and disappearing after 1 h. This H3K9me3 spike was concurrent with the recruitment of the known H3K9 histone methyltransferase, SUV39H1. The H3K9me3 spike was followed by a coordinated pattern of DSB repair factor recruitment, beginning with MRE11, Tip60, and ATM, followed by RPA (indicating end-resection) and finally by BRCA1 and RAD51. In contrast, in cells with high 2HG, fumarate or succinate, H3K9me3 at the site was already elevated at time zero, prior to DSB induction, and remained elevated, while the subsequent recruitment of the HDR factors was substantially attenuated. Importantly, while H3K9me3 levels show a rapid spike at the induced DSB in control cells, in oncometabolite-treated cells the pre-existing and persistent H3K9 hypermethylation masks any potential spike (further quantified in Fig. 2c).
Cell cycle profiling showed no G1 stalling in cells with elevated oncometabolites (Extended Data Fig. 4a–c), while growth rates were slightly slower than in controls (Extended Data Fig. 4d). Based on foci formation and functional assays, neither non-homologous end-joining (NHEJ) nor the micro-homology mediated end joining (MMEJ) pathways were suppressed by elevated metabolites (Extended Data Fig. 4e–n).
HDR is dependent on end-resection of DNA at the DSB to generate single-stranded DNA (ssDNA). To examine end-resection, we used a site-specific, quantitative PCR method16 to measure ssDNA production following activation of I-SceI (Fig. 2d). In control cells, we found that at 3 h after DSB induction, there is protection of a qPCR product ~450 bps from the I-SceI site, consistent with end-resection (Fig. 2e). However, treatment of cells with 2HG, succinate, or fumarate reduced this protection, suggesting a defect in end-resection.
We next used laser micro-irradiation to monitor histone dynamics at DSBs induced in a stripe across the nucleus. In cells with elevated 2HG, we observed high background levels of H3K9me3 in unirradiated nuclei versus low levels in WT cells (Fig. 2f and Extended Data Fig. 5a). Upon laser micro-irradiation, we observed that H3K9me3 was locally deposited at the stripe in WT, which was not seen in cells with elevated 2HG. Similar results were seen in other cell lines with or without elevated 2HG, fumarate or succinate (Extended Data Fig. 5b–m).
Tip60 activation at DSBs is known to be dependent on local H3K9 trimethylation, leading to Tip60-mediated activation of ATM17–19. We further evaluated the H3K9me3-Tip60-ATM- recognition and signaling axis18,20 and found that cells with elevated metabolites (mIDH1, FH−/−, shFH and shSDHB and/or treatment with metabolites) have a marked defect in Tip60 and phospho-ATM (pATM) foci formation after IR (Fig. 2g and Extended Data Fig. 6a–h).
Cells with elevated metabolites also showed deficient ATM activation based on reduced phosphorylation of ATM S1981 at after IR (Extended Data Fig. 6i). We also found a defect in phosphorylation at S*Q motif sites (targets for ATM) (Extended Data Fig. 6j). pATM foci were highly colocalized with Tip60 foci (80%) in control cells (Extended Data Fig. 6k), but not in cells treated with 2HG, fumarate or succinate (Extended Data Fig. 6k). Levels of phospho-RPA (pRPA), phospho-ATR (pATR) and phospho-CHK1 (pCHK1) were also reduced in oncometabolite producing cells (Extended Data Fig. 6l). CHK2 phosphorylation was partially reduced.
Next, we tested the effect of exogenous α-ketoglutarate (αKG) to out-compete the elevated metabolites and restore αKG-dependent dioxygenase function7. We found that αKG treatment of oncometabolite producing cells decreased global H3K9 trimethylation (Extended Data Fig. 7a,b) and restored Tip60, pATM, and RAD51 foci formation (Extended Data Fig. 7c–h). αKG treatment suppressed H3K9me3 hypermethylation by elevated 2HG, succinate and fumarate on western blot (Extended Data Fig. 7i), and on ChIP analysis at the I-SceI locus in the absence of a break (Extended Data Fig. 7j). αKG treatment also restored the spike in H3K9me3 and recruitment of HDR factors at the DNA DSB (Extended Data Fig. 7k–r and Extended Data Fig. 7s–aa), resulting in functional restoration of HDR in the DR-GFP assay (Extended Data Fig. 7bb).
In other rescue experiments in endogenous mIDH1 and FH −/− cells, overexpression of KDMA and KDM4B, but not the catalytically inactive mutants, KDM4A H188A21 and KDM4B H189A22, suppressed H3K9 hypermethylation, restored Tip60 and RAD51 foci, and suppressed the elevated DSBs in the comet assay (Fig. 3a and Extended Data Fig. 8a–j). Overexpression of KDM4A or KDM4B also suppressed H3K9 hypermethylation (Extended Data Fig. 8k), reduced the comet tails (Extended Data Fig. 8l), and restored BRCA1 and RAD51 foci (Extended Data Fig. 8 m–p) in other sets of oncometabolite producing cells.
Figure 3. Oncometabolites suppress HDR via inhibition of KDM4B.
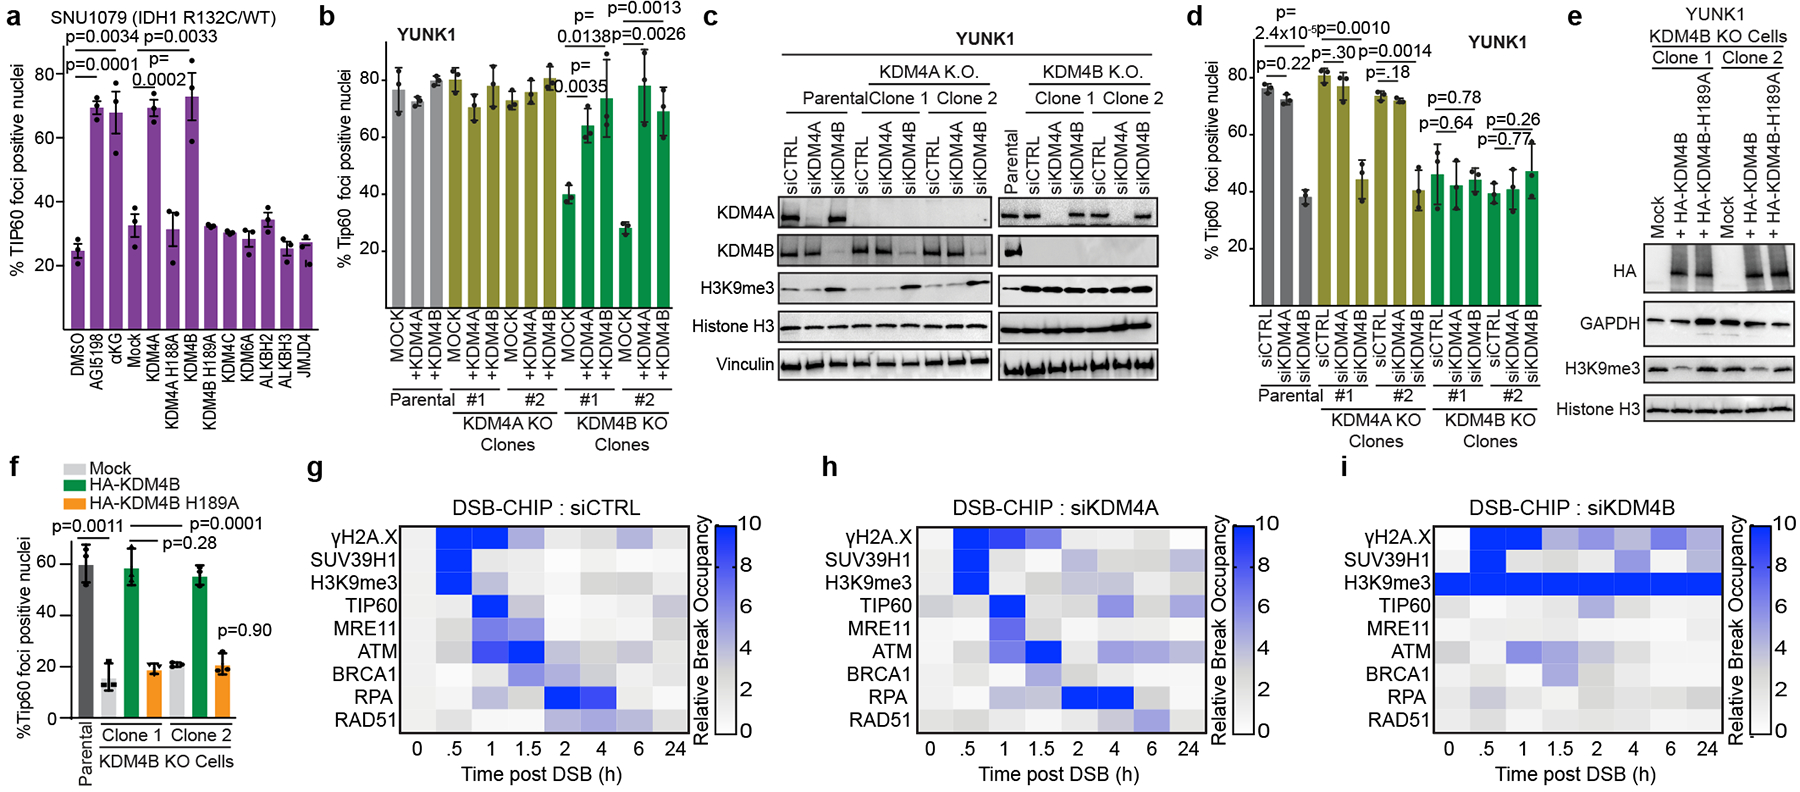
(a) Quantification of Tip60 foci positive nuclei in SNU1079 (IDH1 R132C/WT) cells upon IR after transfection with expression vectors for the indicated αKG-dependent dioxygenases compared to treatment with 2mM αKG or 1 μM AGI-5198. (c) Western blot analysis and (d) Tip60 foci quantification (1h after 2 Gy IR) in KDM4A or KDM4B knockout YUNK1 cells after transfection with the indicated siRNAs. (e) Western blot analysis and (f) quantification of Tip60 foci post IR in YUNK1 cells after transfection with expression constructs for WT KDM4B or catalytically inactive KDM4B H189A. (g-i) Heatmap representation of DSB-ChIP assays in U2OS cells after transfection with (g) non-targeting control siRNA, (h) siKDM4A or (i) siKDM4B. For a, b, d, and f, bars represent mean +/− standard error with n=3 biological replicates and statistical analysis by two tailed, unpaired t-test, df=4. Western blots in c and e were performed 2 times with similar results.
In contrast, there was no detectable rescue of any of these endpoints by overexpression of other αKG-dependent dioxygenases7,8,23, including KDM4C, KDM6A, ALKBH2, ALKBH3, and JMJD4 (Fig. 3a and Extended Data Fig. 8a–j). We also ruled out a role for HIF-1 (Extended Data Fig. 8q,r).
We next generated individual KDM4A and KDM4B knockout cells in the YUNK1 cell background (Extended Data Fig. 8s). Importantly, knockout of KMD4B, but not of KDM4A, induced high levels of H3K9 trimethylation (Extended Data Fig. 8s), impaired Tip60 and RAD51 foci formation (Fig. 3b and Extended Data Fig. 8t) and caused persistence of DSBs (Extended Data Fig. 8u). Forced expression of KDM4A or KDM4B rescued all these endpoints in KDM4B knockout cells (Fig. 3b and Extended Data Fig. 8t–v).
Next, we conducted experiments knocking down KDM4A and KDM4B in either the KDM4A or KDM4B knockout cells as well as the parental control cells (Fig 3c). We found that only KDM4B loss, either by knockdown or knockout, induces an HDR deficiency as measured by Tip60 and RAD51 foci formation or the comet assay (Fig. 3d and Extended Data Fig. 9a,b). To link the effect of KDM4B loss on HDR to its catalytic activity, we complemented KDM4B knockout cells with either WT KDM4B cDNA or the catalytically inactive KDM4B H189A variant22 (Fig. 3e). WT KDM4B, but not KDM4B H189A, suppressed H3K9me3 hypermethylation (Fig. 3e), rescued Tip60 and RAD51 foci (Fig. 3f and Extended Data Fig. 9c) and reduced DSBs (Extended Data Fig 9d), indicating the catalytic activity of KDM4B is necessary for HDR.
Consistent with the data from the YUNK1 cells, knockdown of KDM4B, but not KDM4A, increased the overall level of H3K9me3 across the genome and at the reporter locus in the U2OS DSB CHIP cells (Extended Data Fig 9e,f), impaired the recruitment of repair factors to the DSB in the DSB-ChIP assay (Fig. 3g–I and Extended Data Fig. 9g–o), and produced an increase in comet tails (Extended Data Fig. 9p), similar to the effects of the oncometabolites. These results connect loss of KDM4B activity to HDR deficiency and show that while forced overexpression of KD4MA can compensate for KDM4B loss, physiological levels of KDM4A cannot compensate for loss of KDMB loss.
To directly test KDM4B loss of function as the key mediator in oncometabolite-induced HDR deficiency, we conducted a series of epistasis experiments. We found that loss of KDM4B, but not KDM4A, either by knockout or siRNA suppression, reduced HDR and was epistatic to 2HG produced by mutant IDH1, specifically placing KDMB in the pathway of oncometabolite-mediated HDR suppression (Extended Data Fig. 9q–w). Consistent with a KDM4B associated HDR defect, we detected a decrease in cell proliferation rate with KDM4B knockout (Extended Data Fig. 9x–z). Interestingly, KDM4B knockout mice are born at a normal Mendelian ratio24, so while KDM4B inhibition affects HDR in human cells, it is not an essential gene in mice, similar to results seen with ATM knockout25.
To experimentally uncouple histone hypermethylation at H3K9 from KDM4B inhibition, we expressed the histone mutant H3K9M, which acts in trans to reduce genomic H3K9me3 formation by sequestering the histone methyltransferases that can act on H3K926 (Extended Data Fig. 9aa). We also compared H3K9G, H3K9R, and H3K9R mutants (Fig. 4a) along with similar constructs for other H3 lysine residues (H3K4, H3K27 and H3K36), since elevated metabolites also cause hypermethylation of these lysine residues7,8,10 (Extended Data Fig. 9bb). Only H3K9M expression reduced the H3K9me3 levels in oncometabolite producing cells (Extended Data Fig. 9aa) and did so without affecting oncometabolite levels (Extended Data Fig. 9cc), meaning that KDM4B is still inhibited7.
Figure 4. Aberrant H3K9 methylation impairs HDR and mechanistically underlies oncometabolite induced HDR deficiency.

(a) Quantification of Tip60 foci positive nuclei in SNU1079 cells after expression of the indicated H3 mutant constructs or after treatment with the mIDH1 inhibitor, AGI-5198. (b-e) Heatmap representation of DSB-ChIP assays after transfection with either WT H3 or H3K9M and treatment with either DMSO control or 2HG, as indicated. (f) Confirmation by ChIP of H3K9me3 levels in WT and IDH1 R132H-expressing astrocytes at selected loci identified by analysis of published ChIP-seq data to show either differential H3K9me3 levels (high H3K9me3 in IDH1 R132H-expressing astrocytes and low in WT astrocytes), low H3K9me3 levels in both cell lines, or high H3K9me3 levels in both. (g,h) ChIP analysis of (g) Tip60 and (h) RAD51 recruitment 12 h after Cas9/guide RNA nucleofection to generate site-specific DSBs at the loci profiled in f in the IDH1 WT and IDH1 R132H astrocyte cell lines. (i) ChIP analysis over time of H3K9me3 levels at the same loci as in f-h following Cas9/guide RNA nucleofection. For a, f, g, and h, bars represent mean +/− standard error with n=3 biological replicates and statistical analysis by two tailed, unpaired t-test, df=4. For i, line runs through the mean +/− SEM of 3 biological replicates with statistical analysis by ANOVA, with p values indicated.
We found that only expression of H3K9M could restore Tip60 foci (Fig 4a) and suppress comet tails in mIDH1 and FH-deficient cells (Extended Data Fig. 10a,b). H3K9M expression also suppressed comet tails, restored H3K9me3 levels, and increased ATM activation in SDHB and FH deficient cells (Extended Data Fig. 10c–e). Importantly, we did not observe a rapid DSB-dependent spike in trimethylation at any of these other H3 lysines as we do with H3K9me3 (Extended Data Fig. 10f).
H3K9M expression in the U2OS DSB-ChIP cells suppressed H3K9me3 hypermethylation in spite of the presence of high levels of 2HG, both globally (Extended Data Fig. 10g) and at the DSB locus (Extended Data Fig. 10h). H3K9M expression also restored the local H3K9me3 methylation spike at the DSB and the recruitment of HDR factors, in spite of high 2HG (Fig. 4b–e and Extended Data Fig 10i–q). These results support the hypothesis that elevated levels of oncometabolites inhibit HDR because they increase baseline H3K9me3 hypermethylation, masking the ability of the cell to generate an H3K9me3 spike at a DSB, causing impaired recruitment of repair factors.
With H3K9M expression in cells with elevated 2HG (Fig. 4e), the H3K9me3 ChIP signal disappears from the break over time (as it does in control cells) even though KDM4B demethylase activity is inhibited by the 2HG. To explain this, we note that this loss of the H3K9me3 signal correlates with loss of total H3 from the locus (Extended Data Fig. 10r), consistent with histone eviction occurring with end resection during repair. Interestingly, we found that KDM4A and KDM4B are recruited to the DSB (Extended Data Fig. 10s). Since the experiments above show that local demethylation is not required once HDR is initiated, this may reflect the established role for these factors in competition with 53BP1 for binding to H4K20me2 at the break27.
We also tested for the effect of H3K9R on HDR in WT cells, since it mimics an unmodifiable lysine residue. We found that H3K9R expression in WT cells produces elevated comet tails and suppression of Tip60 and RAD51 foci (Extended Data Fig. 10t–v), indicating an induced HDR defect. H3K9R also sensitized WT U87 cells to PARP inhibition (Extended Data Fig. 10w), but it did not have any further effect on the inherent PARP inhibitor sensitivity in mIDH1 cells (demonstrating epistasis). In contrast, H3K9M expression rescued the PARP inhibitor sensitivity in mIDH1 cells.
We next tested whether HDR might still be able to occur at sites in which the H3K9me3 levels were low at baseline even in cells with high 2HG. By analysis of published ChIP-seq data generated from the IDH1 R132H mutant and WT astrocytes (Extended Data Fig. 10x)28, we identified three types of genomic sites in the mIDH1 and WT cells: (1) hypomethylated at baseline in WT cells but hypermethylated in mIDH1 cells; (2) hypomethylated in both; and (3) hypermethylated in both, confirmed by ChIP (Fig. 4f). Using CRISPR-Cas9 to induce site-specific DSBs at these sites (Extended Data Fig. 10y), we assayed for DNA repair factor recruitment via ChIP. In the differentially H3K9 methylated site, we saw recruitment of HDR factors by ChIP in the WT but not mIDH1 astrocytes (Fig. 4g,h and Extended Data Fig. 10z,aa). At the site with low H3K9me3 in both, we observed recruitment of HDR factors in both cases. Importantly, at this site, an H3K9me3 signal could be produced at the DSB not only in the WT astrocytes, but also in the IDH1 mutant ones (Fig. 4i). At the site with high H3K9me3 in both, there was no H3K9me3 signal above background in either the WT or mIDH1 cells and recruitment of HDR factors was attenuated. These results support our model that it is the pre-existing H3K9me3 hypermethylation (caused by metabolite inhibition of KDM4B) that inhibits repair of DSBs by the HDR pathway because the H3K9me3 signal cannot be generated. Consistent with the need for an H3K9me3 spike, siRNA knockdown of the H3K9 histone methyltransferase, SUV39H1, impaired HDR (Extended Data Fig 10bb–dd), consistent with Ayrapetov et al17.
The above experiments provide a direct link between oncometabolite-induced HDR deficiency, KDM4B inhibition, and H3K9me3 status. They identify H3K9 methylation as the key regulatory target in the pathway by which elevated metabolites cause decreased HDR. This pathway is characterized in normal cells by a rapid spike in H3K9 trimethylation that coordinates recruitment of Tip60 and MRE11, promoting ATM activation, licensing end resection, and leading to the downstream recruitment of RPA, BRCA1 and RAD51. In metabolite over-producing cells, much of the genome has high levels of H3K9me3, and at such regions, this H3K9me3 signal is not properly induced. The constitutively high levels of H3K9me3 prevent a hypermethylation spike, which impairs HDR factor recruitment and end-resection, conferring sensitivity to PARP inhibitors. These results reveal a novel pathway by which metabolism influences DNA repair and may provide the basis for new therapeutic strategies for patients with metabolite-associated malignancies.
Extended Data
Extended Data Figure 1. Elevated oncometabolites induce H3K9me3 and impact global gene expression, but do not alter expression of HDR genes.

(a) Liquid chromatography, mass spectrometry (LC-MS) quantification of 2HG levels in cells with engineered IDH1 mutations and in cells with endogenous IDH1/2 mutations, as indicated. Note the engineered IDH1 mutant cells produce 2HG at levels similar to the endogenous mutant cell lines, and that the HT1080 cells with CRISPR/Cas9 knockout of the mutant IDH1 R132C allele (IDH1 KO/WT) show reduction of 2HG production to levels similar to those seen in IDH1 WT cells. 2HG levels are also quantified in endogenous mutant IDH1/2 cells after treatment with the mutant-IDH1-specific inhibitor AGI-5198 and the mutant-IDH2-specific inhibitor AG-221. (b) Western blot analysis of H3K9me3 levels in cell lines with WT IDH1 or engineered to express mutant IDH1, as indicated, as compared the HT1080 cell line with an endogenous IDH1 R132C mutation. (c-d) LC/MS analysis of (c) succinate and (d) fumarate in: YUNK1 cells with shRNA suppression of SDHB or FH compared to shCTRL (non-targeting) control cells, the endogenous FH −/− UOK 262 renal cell carcinoma cell line with and without FH cDNA complementation (clones 1–3), and in the FH −/− NCCFH1 renal cell carcinoma cell line. (e) Western blot analysis of H3K9me3 in: YUNK1 cells with shRNA suppression of SDHB or FH compared to shCTRL (non-targeting) control cells, the endogenous FH −/− UOK 262 renal cell carcinoma cell line with and without FH cDNA complementation, and in the FH −/− NCCFH1 renal cell carcinoma cell line. This experiment was repeated twice with similar results. (f) Western blot analysis of H3K9me3 in HT1080 cells (IDH1 R132C/WT) and in HT1080 cells with CRISPR/Cas9 knockout of the mutant IDH1 allele (IDH1 KO/WT), and with or without treatment with 500 μM 2HG, 1 mM AGI-5198 or 1mM AGI-5198 and 500 μM 2HG. This experiment was repeated twice with similar results. (g) Western blot analysis of H3K9me3 in WT IDH1 U87 glioblastoma cells and in U87 cells with CRISPR/Cas9 knock-in of the mutant IDH1 R132H allele and with or without treatment with 500 μM 2HG, 1 μM AGI-5198 or 1 μM AGI-5198 and 500 μM 2HG. This experiment was repeated three times with similar results. (h) Western blot analysis of H3K9me3 in FH −/− UOK 262 cells with or without FH cDNA complementation (clones 1–3) and with or without treatment with 30 μM dimethyl-fumarate. (i) Plot of microarray gene expression analysis of astrocytes either overexpressing WT IDH1 or IDH1 R132H. Genes were plotted in descending order based on the ratio of IDH1 WT expression levels to that of IDH1 R132H. Genes with a high value are highly expressed in WT IDH cells as compared to IDH1 R13H cells, and therefore represent genes that are putatively suppressed in IDH1 R132H expressing cells. (j) Heatmap representation of microarray expression analysis of HDR-associated genes in matched pairs of otherwise isogenic IDH WT and R132H mutant cells: WT IDH and IDH1 R132H/+ HCT116 cells; human immortalized astrocytes expressing WT IDH1 or IDH1 R132H, and WT IDH or IDH1 R132H/+ HeLa cells. (k) Dot-plot of expression levels of HDR-associated genes from the TCGA lower grade glioma mRNA seq data set. For each gene, patient samples are separated by IDH status. (l) Western blot analyses of IDH1 R132H, total IDH1, FH, SDHB, RAD51, ATM, BRCA2, Tip60, RPA, MRE11 in: YUNK1 cells with shRNA suppression of SDHB or FH compared to shCTRL (non-targeting) control cells and in WT IDH or IDH1 R132H overexpressing astrocytes. This experiment was repeated four times with similar results. (m-n) representative images of neutral comet assays performed in (m) immortalized astrocytes overexpressing WT IDH1 or IDH1 R132H or treated with 500 μM octyl-(R)-2HG, 2 mM succinate or 30 μM dimethyl-fumarate and in (n) YUNK1 cells after shRNA suppression of FH or SDHB or addition of 500 μM octyl-(R)-2HG, 2 mM succinate or 30 μM dimethyl-fumarate. Scale bars are 400 μm. (o) LC-MS quantification of 2HG in astrocytes after 2 h treatment with 500 μM R-octyl-2HG. (p) Western blot analysis of H3K9me3 levels in astrocytes treated with 500 μM R-octyl-2HG for 2, 4, or 12 h as compared to vehicle control (DMSO cells) or astrocytes expressing IDH1 R132H). This experiment was repeated two times with similar results. (q) LC-MS quantification of succinate in YUNK1 cells after 2 h treatment with 2mM succinate. (r) Western blot analysis of H3K9me3 levels in YUNK1 cells treated with 2mM succinate for 2, 4, or 12 h as compared to vehicle control (DMSO) cells or YUNK1 cells with shRNA suppression of SDHB. This experiment was repeated two times with similar results. (s) LC-MS quantification of fumarate in YUNK1 cells after 2 h treatment with 30 μM dimethyl-fumarate. (t) Western blot analysis of H3K9me3 levels in YUNK1 cells treated with 2mM succinate for 2, 4, or 12 h as compared to vehicle control (DMSO) cells or YUNK1 cells with shRNA suppression of FH. This experiment was repeated two times with similar results. For a,c,d,o,q, and s bars represent mean +/− standard error with n=3 biological replicates and statistical analysis by two tailed, unpaired t-test, df=4, with p values as indicated.
Extended Data Figure 2. Oncometabolites directly impair RAD51 and BRCA1 foci formation after IR and cause radiosensitization.

(a) Quantification of RAD51 nuclear foci at the indicated time-points upon 2 Gy ionizing radiation (IR), in WT IDH or IDH1 R132H/+ HeLa cells. Statistical analysis of time course by ANOVA, F=35.15 df=1. Statistical analysis at specific time points by two tailed, unpaired t-test, df=4. (b) Representative images of RAD51 nuclear foci at 4 h after 2 Gy IR in WT IDH or IDH1 R132H/+ HeLa cells. These experiments were performed 3 times as quantified in a. Scale bar is 10 μm. (c) Western blot analysis of FH and SDHB in HEK293FT shCTRL (non-targeting control), shSDHB, and shFH cells. These experiments were repeated 6 times. (d) Quantification of RAD51 nuclear foci at the indicated time-points following 2 Gy IR in HEK293FT cells with shRNA suppression of SDHB or FH compared to non-targeting control (shCTRL) cells, and in shCTRL cells treated with either 2 mM succinate or 30 μM dimethyl-fumarate. Statistical analysis of time course by ANOVA. F values vs CTRL: shSDHB F=61.55, shFH F=195.3, +succinate F=258.2, +fumarate F = 242.4, df=1 for all tests. Statistical analysis at indicated time points by two-tailed, unpaired, t-test, df=4. (e) Representative images of RAD51 nuclear foci at 4 h post IR in HEK293FT cells with shRNA suppression of SDHB or FH compared to non-targeting control (shCTRL) cells. Scale bar is 10 μm. These experiments were performed 3 times and quantified in d. (f) Quantification of cells with RAD51 foci positive nuclei (>10 foci per nucleus) 4 h after 2 Gy IR parental U87 glioma cells (WT IDH1) and in U87 cells with CRISPR/Cas9-mediated knock-in of an IDH1 R132H allele at the endogenous locus (IDH1 R132H/WT). Cells were treated as indicated with or without 500 μM octyl-(R)-2HG (2HG) for 24 h, 1 mM AG1–5198 for 5 days or a combination thereof, before irradiation. (g) Quantification of RAD51 foci positive nuclei in SNU1079 (IDH1 R132C/WT) and RBE (IDH1 R132S/WT) cholangiocarcinoma cells, and SW1353 (IDH2 R172K/WT) chondrosarcoma cells 4h after 2 Gy IR. Mutant IDH1 Cells were treated with or without 2HG or AGI-5198 or AGI-5198 + 2HG as in (f) and the mutant IDH2 SW1353 cells were treated with or without 2HG or AG-221 or AG-221 + 2HG. (h) Representative images of BRCA1 nuclear foci at 4 h after 2 Gy IR. Scale bar is 10 μm. This experiment was repeated 3 times and is quantified in i and j. (i) Quantification of BRCA1 nuclear foci at the indicated time-points upon 2 Gy IR, in WT IDH or IDH1 R132H/+ HeLa cells. Statistical analysis of time course by ANOVA, F=41.35 df=1. Statistical analysis at specific time points by two tailed, unpaired t-test, df=4. (j) Quantification of BRCA1 nuclear foci at the indicated time-points following 2 Gy IR in YUNK1 cells with shRNA suppression of SDHB or FH compared to non-targeting control (shCTRL) cells, and in shCTRL cells treated with either 2 mM succinate or 30 μM dimethyl-fumarate. Statistical analysis of time course by ANOVA. F values vs CTRL: shSDHB F=20.92, shFH F=37.42, +succinate F=19.89, +fumarate F = 11.57, df=1 for all tests. Statistical analysis at indicated time points by two-tailed, unpaired, t-test, df=4. (k) Quantification of BRCA1 foci positive cells (>10 nuclear BRCA1 foci) 4 h after 2 Gy IR in SNU1079 (IDH1 R132C/WT), RBE (IDH1 R132S/WT) and HT1080 (IDH1 R132C/WT) cells treated with 1 μM AGI-5198 or with DMSO control. (l) Quantification and (m) representative images of BRCA1 nuclear foci 4 h after 2 Gy IR in SW1353 (IDH2 R172K/WT) cells treated as indicated with DMSO (control), 500 μM 2HG, 5 μM AG-221 or 5 μM AG-221 and 500 μM 2HG. Scale bar is 10 μm. The images from m are from experiments that were repeated three times and are quantified in l. (n) Clonogenic survival assay in U87 glioblastoma cells with or without mutant IDH1 R132H treated with the indicated doses of IR. (o) Tumor growth delay assay in U87 WT IDH1 and U87 IDH1 R132H/WT tumor xenografts. Mice were treated with a single dose of 8 Gy IR or mock irradiated at a tumor volume of 150 mm3. N= 8 mice per group each with a single tumor. Statistical analysis by ANOVA (WT IDH1 F=4.25, df=1, IDH1 R132H F=13.76, df=1) (p) Western blot analysis of H3K9me3 in U87 WT IDH1 and U87 IDH1 R132H/WT tumor xenografts. This experiment was performed 3 times with similar results. For f,g,k, l, bars represent mean +/− standard error with n=3 biological replicates and statistical analysis by two tailed, unpaired t-test, df=4. For a,d,i,j, and n lines run through the mean +/− SEM of 3 biological replicates with statistical analysis by ANOVA. p values are indicated in the figure panels.
Extended Data Figure 3. Supporting data for DSB-ChIP assays to analyze recruitment of DNA repair factors to an I-SceI-induced, site-specific DNA double-strand break.

(a) (Top) Schematic diagram of the quantitative PCR analysis to assess I-SceI cleavage at the DSB-ChIP site. (Bottom) Quantitative PCR analysis to assay site-specific DNA DSB induction at 1 h after addition of the ligands Shield-1 and triamcinolone. Reduced amplification of the genomic DNA across the I-SceI target indicates that cleavage at that site has occurred; as such, short bars indicate reduced PCR amplification and therefore successful cleavage. (b-j) Pertaining to Fig. 2b, line graphs of percent input values for DSB-ChIP assays performed with the indicated antibodies in cells treated as indicated with either DMSO, 500 μM ocyl-R-2HG, 2 mM succinate, or 30 μM dimethyl-fumarate, for the following factors: (b) γH2A.X (+2HG, F=10.8, +succinate F = 2.682, +fumarate F=17.8); (c) SUV39H1 (+2HG F=0.33, +succinate F =3.5, +fumarate F=0.07); (d) H3K9me3 (+2HG F=124.4, +succinate F =25.21, +fumarate F=517); (e) Tip60 (+2HG F=218, +succinate F =340.7, +fumarate F=248.6); (f) MRE11 (+2HG F=97.7, +succinate F =209.9, +fumarate F=71.2; (g) ATM (+2HG F=46.8, +succinate F =31.7, +fumarate F=47.3); (h) BRCA1 (+2HG F=50.0, +succinate F =50.7, +fumarate F=24.1); (i) RPA32 (+2HG F=23.59, +succinate F =22.3, +fumarate F=16.0); and (j) RAD51 (+2HG F=43.3, +succinate F =61.8, +fumarate F=11.75) at the indicated time-points post addition of triamcinolone and Shield-1 to induce an I-SceI break in DSB-ChIP U2OS cells. (k-l) Line graphs of % input values for DSB-ChIP assays performed with IgG controls for (k) rabbit IgG and (l) mouse IgG at the indicated time-points post addition of triamcinolone and Shield-1 to induce an I-SceI break in DSB-ChIP cells treated with either DMSO, 500 μM octyl-R-2HG, 2 mM succinate, or 30 μM dimethyl-fumarate. (m-u) Antibody validation experiments for the DSB-ChIP assays. Each panel includes a western blot analysis of target protein knockdown by siRNA (with three biological replicates in each case and quantification of western blot band intensities normalized to β-actin loading control and presented below each lane), an accompanying bar graph quantifying the knockdown data showing mean +/−SEM, with dots indicating individual values for each of the biological replicates, and then a DSB-ChIP assay performed with the same antibody for the respective target protein with and without siRNA knockdown, as follows: (m) γH2A.X (F=12.3, df=1); (n) SUV39H1 (F=10.49, df=1); (o) H3K9me3 ChIP assay after siRNA knockdown of the H3K9 methyltransferase, SUV39H1 (as shown in n) (F=10.34, df=1); (p) Tip60 (F=8.13, df=1); (q) MRE11 (F=26.1, df=1); (r) ATM (F=29.9, df=1); (s) BRCA1 (F=23.17, df=1), (t) RPA32 (F=97.5, df=1), and (u) RAD51(F=9.4, df=1). For a, bars represent mean +/− standard error with n=3 biological replicates and statistical analysis by two tailed, unpaired t-test, df=4, with p values as indicated. For b-u, lines run through the mean +/− SEM of 3 biological replicates with statistical analysis by ANOVA with p values indicated.
Extended Data Figure 4. Elevated metabolites have minimal effects on cell cycle distribution, growth rates, and non-homologous end-joining (NHEJ) DNA repair.

(a,b) Cell cycle profile plots based on DNA content by flow cytometry for U2OS DSB-ChIP cells treated with either (a) DMSO (control) or (b) with the indicated metabolites: 500 μM octyl-R-2HG, 2 mM succinate, or 30 μM dimethyl-fumarate. (c) Quantification of cell cycle analyses in: YUNK1 cells with shRNA suppression of SDHB or FH compared to shCTRL (non-targeting) controls; U2OS DSB-ChIP cells treated with DMSO, 500 μM octyl-R-2HG, 2 mM succinate, or 30 μM dimethyl-fumarate; astrocytes expressing WT IDH1 or IDH1 R132H; SNU1079 (IDH1 R132C/+) cells treated with DMSO or 1 μM AGI-5198; and UOK 262 FH −/− renal cell carcinoma cells with and without FH cDNA complementation. (d) Serial cell counts over time of the indicated cells in standard culture conditions: U87 IDH1 R132H/WT glioblastoma cells compared to WT IDH1 U87 cells; astrocytes expressing WT IDH1 or IDH1 R132H; UOK 262 FH −/− renal cell carcinoma cells with and without FH cDNA complementation; and YUNK1 cells with shRNA suppression of SDHB or FH compared to shCTRL (non-targeting) control cells. Points represent mean +/− SEM of 3 biological replicates. Line runs through the mean +/− SEM of 3 biological replicates. p values by ANOVA are indicated in the figure panels. Additional statistics: for U87 F=24.69 (df=1), astrocytes F=26.00 (df=1), UOK262 F=29.64 (df=1), YUNK1 shSDHB F=16.11 (df=1), and YUNK1 shFH F=89.47 (df=1). (e) pDNA-PKcs foci formation (using an antibody to phosphorylated DNA-PKcs) at 4 h post 2Gy IR quantified as % foci positive nuclei (> 10 foci per nucleus) in: SNU1079 cells (IDH1 R132H/WT) and HT1080 (IDH1 R132C/WT) cells treated with 1 μM AGI-5198 or DMSO control; U87 glioblastoma IDH1 WT and IDH1 R132H/WT cells; astrocytes overexpressing WT IDH1 or IDH1 R132H; UOK 262 FH −/− renal cell carcinoma cells with and without FH cDNA complementation; and NCCFH1 FH −/− renal cell carcinoma cells with or without FH complementation. Representative images from SNU1079 (IDH1 R132C/WT) cells with and without AGI-5198 treatment are shown. Scale bar is 20 μm. (f) Schematic diagram of the luciferase based NHEJ assay. (g) Quantification of relative NHEJ by the luciferase-based NHEJ assay in HeLa cells, Hela cells after siRNA suppression of Ku80 (positive control for NHEJ deficiency), IDH1 R132H/WT HeLa cells, astrocytes overexpressing WT IDH1 or IDH1 R132H, U87 glioblastoma IDH1 WT and U87 IDH1 R132H/WT cells, and YUNK1 cells with shRNA suppression of SDHB or FH compared to shCTRL (non-targeting) control cells. (h) Western blot analysis to confirm Ku80 knockdown after siRNA suppression of Ku80 in HeLa cells. This experiment was performed 2 times with similar results. (i) Schematic diagram of the EJ5-GFP NHEJ reporter. (j) Quantification of NHEJ using the EJ5 chromosomally integrated reporter assay in U2OS-EJ5 reporter cells after treatment of cells with 500 μM octyl-R-2HG, 2 mM succinate, or 30 μM dimethyl-fumarate compared to DMSO control and to cells with siRNA knockdown of Ku80. (k) Quantification of Ku80 levels after siRNA suppression of Ku80 in U2OS-EJ5 reporter cells. This experiment was performed 2 times with similar results. (l) Schematic diagram of the EJ2-GFP reporter to assay microhomology mediated end-joining (MMEJ). (m) Quantification of EJ2 MMEJ reporter activity in EJ2-HEK293FT cells after treatment with 500 μM octyl-R-2HG, 2 mM succinate, or 30 μM dimethyl-fumarate compared to DMSO control. Treatment with PARP inhibitor (PARPi) BMN-673 is used as a positive control for PARP-dependent MMEJ. (n) Western blot levels of poly-ADP-ribose (PAR) levels after treatment with the PARPi BMN-673 at 10nM. This experiment was performed 2 times with similar results. For c,e,g,j and m, bars represent mean +/− standard error with n=3 biological replicates and statistical analysis by two tailed, unpaired t-test, df=4.
Extended Data Figure 5. Elevated metabolites disrupt normal H3K9me3 deposition at sites of DNA damage caused by laser stripe micro-irradiation.

(a) Quantification of H3K9me3 intensity in the laser micro-irradiated stripe above background after laser micro-irradiation induction of DNA damage in HeLa cells treated with or without 2HG or expressing an IDH1 R132H mutation, as indicated. (F=49.27, df=1) (b-c) Representative immunofluorescence images of γH2AX and H3K9me3 in cell nuclei in parental U87 glioblastoma cells (WT IDH1) and U87 cells with CRISPR/Cas9-mediated knock-in of an IDH1 R132H allele at the endogenous locus (IDH1 R132H/WT) (b) without DNA damage or (c) 1 min after laser micro-irradiation induction of DNA damage at 150 μJ/pixel. Scale bars are 20 μm. (d) Quantification of H3K9me3 intensity in the laser micro-irradiated stripe above background after the indicated time-points in the U87 cell line matched pair after laser micro-irradiation. (F=5.360 df=1) (e-f) Representative images of (e) undamaged and (f) laser micro-stripe irradiated YUNK1 cells with shRNA suppression of SDHB or FH compared to non-targeting control shRNA (shCTRL), or in YUNK1 cells treated with 2 mM succinate or 30 μM dimethyl-fumarate. Cells were pretreated with exogenous metabolites 24 h before micro-stripe irradiation and then were analyzed at 1 min after irradiation. Scale bars are 20 μm. (g) Quantification of H3K9me3 intensity in the laser micro-irradiated stripes above background at the indicated time-points after laser micro-irradiation in the YUNK1 cells treated as indicated. (shSDHB F=31.25, df=1, +Succinate F=33.80, df=1, shFH F=32.25, df=1, +fumarate F=44.39, df=1) (h-i) Representative images of (h) undamaged and (i) laser micro-stripe irradiated HEK293FT cells with shRNA suppression of SDHB or FH compared to non-target control shRNA (shCTRL), or in HEK293FT cells treated with 2 mM succinate or 30 μM dimethyl-fumarate. Cells were pretreated with exogenous metabolites 24 h before micro-stripe irradiation and were analyzed at 1 min after irradiation. Scale bars are 20 μm. (j) Quantification of H3K9me3 intensity in the laser micro-irradiated stripe above background at the indicated times after laser micro-irradiation in the HEK293FT cells treated as indicated. (shSDHB F=8.68 df=1, +Succinate F=13.75 df=1, shFH F=10.84, df=1, +fumarate F=14.05, df=1) (k-l) Representative images of (k) undamaged and (l) laser micro-stripe irradiated SW1353 (IDH2 R172K/WT) chondrosarcoma cells treated as indicated with DMSO, 500 μM octyl-(R)-2HG, 5 μM AG-221, or 5 μM AG-221 and 500 μM octyl-(R)-2HG. Scale bars are 20 μm. (m) Quantification of H3K9me3 intensity in the laser micro-irradiated stripe above background at 2 min after laser micro-irradiation in the SW1353 (IDH1 R172K/WT) chondrosarcoma cells treated as indicated. For a, d, g, and j, line runs through the mean +/− standard error with n=3 biological replicates for each time-point and statistical analysis by ANOVA. For m bars represent mean +/− standard error with n=3 biological replicates and statistical analysis by two tailed, unpaired t-test, df=4. p values are indicated in the panels.
Extended Data Figure 6. Oncometabolites impair Tip60 and ATM recruitment and activation following treatment of cells with ionizing radiation.

(a) Quantification of Tip60 foci positive 1h after 2 Gy IR in SW1353 (IDH2 R172K/WT) cells treated as indicated with DMSO (control), 500 μM 2HG, 5 μM AG-221 or 5 μM AG-221 and 500 μM 2HG. (b) Quantification and representative images of Tip60 foci positive nuclei 4 h after 2 Gy IR in FH-deficient UOK 262 renal cell carcinoma cells (FH −/−) and in three subclones complemented with FH cDNA, with or without treatment with 30 μM dimethyl-fumarate for 24 h before 2 Gy IR. Scale bars are 100 μm. (c) Quantification and representative images of pATM (S1981) foci positive nuclei 4 h after 2 Gy IR in HT1080 fibrosarcoma cells (IDH1 R132C/WT) and in HT1080 cells with a CRISPR/Cas9-mediated knockout of the IDH1 R132C allele (IDH1 KO/WT) treated as indicated with DMSO control, 2HG, AGI-5198, or AGI-5198 + 2HG. Scale bars are 100 μm. (d) Quantification and representative images of pATM (S1981) foci positive nuclei 4 h after 2 Gy IR in FH-deficient UOK 262 renal cell carcinoma cells (FH −/−) and in a subclone complemented with FH cDNA. Scale bars are 100 μm. (e) Quantification of cells with Tip60 foci positive nuclei (>10 foci per nucleus) 1 h after 2 Gy IR in U87 WT IDH1 and U87 IDH1 R132H/WT glioblastoma cells, immortalized astrocytes overexpressing WT IDH1 or IDH1 R132H, HeLa cells WT for IDH1 or IDH1 R132H/WT, and YUNK1 and HEK293FT cells with shRNA suppression of SDHB (shSDHB) or FH (shFH) compared to non-targeting control shRNA (shCTRL). (f) Quantification of cells with phospho-ATM on residue S1981 (pATM S1981) foci positive nuclei (>10 foci per nucleus) 1 h after 2 Gy IR in immortalized astrocytes overexpressing WT IDH1 or IDH1 R132H, HeLa cells WT for IDH1 or IDH1 R132H/WT, and YUNK1 and HEK293FT cells with shRNA suppression of SDHB (shSDHB) or FH (shFH) compared to non-targeting control shRNA (shCTRL). (g) Representative immunofluorescent images of Tip60 and pATM S1981 nuclear foci 1 h after 2 Gy IR in HEK293FT cells with shRNA suppression of SDHB or FH compared to non-targeting control shRNA (shCTRL). Scale bar is 20 μm. (h) Quantification of cells with pATM S1981 foci positive nuclei (>10 foci per nucleus) and representative immunofluorescent images of pATM S1981 foci 1 h after 2 Gy IR in SNU1079 (IDH1 R132C/WT) cholangiocarcinoma cells treated with mIDH1 inhibitor, 1 μM AGI-5198, or DMSO control. Scale bars are 100 μm. (i) Western blot analysis of pATM S981 and total ATM at 1 h after 2 Gy IR in YUNK1 cells with shRNA suppression of SDHB (shSDHB) or FH (shFH) compared to non-targeting control shRNA (shCTRL) and in immortalized astrocytes overexpressing WT IDH1 or IDH1 R132H. This experiment was performed 3 times with similar results. (j) Western blot analysis of phospho-ATM S1981 (pATM) and phospho-S*Q motifs in YUNK1 cells with shRNA suppression of SDHB (shSDHB) as compared to a non-targeting control shRNA (shCTRL). This experiment was performed 2 times with similar results. (k) Quantification and representative images of pATM and Tip60 foci colocalization in HeLa cells treated with DMSO control (CTRL), 500 μM octyl-(R)-2HG, 2 mM succinate or 30 μM dimethyl-fumarate. Scale bar is 5 μm. (l) Western blot analysis of pATM S1981 and total ATM, phospho-ATR and total ATR, phospho-RPA32 and total RPA32, phospho-CHK1 and total CHK1, phospho-DNA-PKcs and total DNA-PKcs, and phospho-CHK2 and total CHK2 in U87 glioblastoma cells WT for IDH or IDH1 R132H/WT 1 h after 5 Gy IR as compared to unirradiated controls. This experiment was performed 2 times with similar results. For a, b, c, d, e, f, h, and k, bars represent mean +/− standard error with n=3 biological replicates and statistical analysis by two tailed, unpaired t-test, df=4, with p values as indicated.
Extended Data Figure 7. α-ketoglutarate supplementation rescues oncometabolite-induced HDR deficiency.

(a-b) Western blot analysis of H3K9me3 levels in the following cells with or without treatment with 2mM dimethyl-alpha-ketoglutarate (αKG) for 96 h: (a) SNU1079 IDH1 R132C/WT cholangiocarcinoma cells, (b) U87 WT IDH1 and IDH1 R132H/WT glioblastoma cells, UOK 262 FH −/− renal cell carcinoma cells with and with FH cDNA complementation, and YUNK1 cells with shRNA suppression of SDHB (shSDHB) or FH (shFH). (c) Quantification of cells with Tip60 foci positive nuclei (>10 foci per nucleus) at 1 h post 2 Gy IR in the following cells with or without treatment with 2mM dimethyl-alpha-ketoglutarate (αKG) for 96 h: U87 WT IDH1 and IDH1 R132H/WT glioblastoma cells, WT IDH1 and IDH1 R132H/WT HeLa cells, UOK 262 FH−/− renal cell carcinoma cells, YUNK1 cells with shRNA suppression of SDHB (shSDHB) or FH (shFH) compared to non-targeting control shRNA (shCTRL), and HEK293FT cells with shRNA suppression of SDHB (shSDHB) or FH (shFH) compared to nontargeting control shRNA (shCTRL). (d-f) Quantification of cells with pATM S1918 foci positive nuclei (>10 foci per nucleus) at 1 h post 2 Gy IR in the following cells treated or not with 2mM αKG for 48h as indicated: (d) HEK293FT cells with shRNA suppression of SDHB (shSDHB) or FH (shFH) compared to non-targeting control shRNA (shCTRL), (e) WT IDH1 and IDH1 R132H/WT HeLa cells, and (f) YUNK1 cells with shRNA suppression of SDHB (shSDHB) or FH (shFH) compared to non-targeting control shRNA (shCTRL). (g) Quantification of cells with RAD51 foci positive nuclei (>10 foci per nucleus) at 4 h post 2 Gy IR in U87 WT IDH1 and IDH1 R132H/WT glioblastoma cells treated with either 2mM αKG for 48 h or with DMSO control. (h) Quantification of cells with RAD51 foci positive nuclei (>10 foci per nucleus) at 4 h post 2 Gy IR in SNU1079 (IDH1 R132C/WT) cholangiocarcinoma cells pre-treated with DMSO, 2 mM αKG or AGI-5198 for 48 h. (i) Western blot analysis of H3K9me3 and total H3 levels in U2OS EJ-DR cells treated with DMSO (control), 2mM αKG, 500 μM octyl-R-2HG, 2 mM succinate, 30 μM dimethyl-fumarate, or the indicated combinations of αKG plus 2HG, succinate or fumarate. (j) ChIP analysis of H3K9me3 occupancy at the DSB-ChIP reporter locus in U2OS cells in the absence of a DSB after treatment with DMSO (control), 500 μM octyl-R-2HG, 2 mM succinate, or 30 μM dimethyl-fumarate, in all cases plus or minus 2mM αKG, as indicated. (k-r) Heatmaps of the relative occupancy of the indicated factors at the site-directed DSB in U2OS cells as measured by ChIP and normalized to the uninduced controls. The assay was performed at the indicated time-points post addition of Shield-1 and triamcinolone in (k) DMSO-treated cells (control), (l) cells treated with 2mM αKG, (m) cells treated with 500 μM octyl-(R)-2HG, (n) cells treated with 2mM αKG and 500 μM octyl-(R)-2HG, (o) cells treated with 2 mM succinate, (p) cells treated with 2 mM succinate and 2mM αKG, (q) cells treated with 30 μM dimethyl-fumarate, and (r) cells treated with 30 μM dimethyl-fumarate and 2mM αKG. The heatmaps for 2HG alone, succinate alone, fumarate alone and DMSO control alone are reproduced from Figure 2b and are presented again here for comparison. (s-aa) Pertaining to the heatmaps in panels l, n, p, and r, line graphs of percent input values for DSB-ChIP assays with antibodies for (s) γH2A.X (αkg+2HG F=0.04, df=1, αkg+succinate F =2.76, df=1, αkg+fumarate F=0.18, df=1); (t) SUV39H1 (αkg+2HG F=0.73, df=1, αkg+succinate F =0.55, df=1, αkg+fumarate F=0.09, df=1); (u) H3K9me3 (αkg+2HG F=0.076, df=1, αkg+succinate F =4.05, df=1, αkg+fumarate F=8.910, df=1); (v) Tip60 (αkg+2HG F=1.32, df=1, αkg+succinate F =1.98, df=1, αkg+fumarate F=107.8, df=1); (w) MRE11 (αkg+2HG F=0.53, df=1, αkg+succinate F =1.2, df=1, αkg+fumarate F=2.3, df=1); (x) ATM (αkg+2HG F=14.8, df=1, αkg+succinate F =0.31, df=1, αkg+fumarate F=8.67, df=1); (y) BRCA1 (αkg+2HG F=3.3, df=1, αkg+succinate F =2.1, df=1, αkg+fumarate F=1.5, df=1); (z) RPA32 (αkg+2HG F=0.003, df=1, αkg+succinate F =1.78, df=1, αkg+fumarate F=0.57, df=1); and (aa) RAD51 (αkg+2HG F=1.4, df=1, αkg+succinate F =2.4, df=1, αkg+fumarate F=3.10, df=1) at the indicated time points post addition of triamcinolone and Shield-1 to induce an I-SceI break in the U2OS DSB-ChIP cells. Line graphs pertaining to panels k,m,o, and q are presented in Extended Data Fig. 3b–j. (bb) Quantification of HDR efficiency as measured by restoration of a functional GFP gene following I-SceI induction of a DSB in the DR-GFP reporter in U2OS cells following pre-treatment with DMSO, 500 μM octyl-R-2HG, 2 mM succinate, and 30 μM dimethyl-fumarate, plus no αKG, 1 mM αKG, or 2mM αKG, as indicated. For c,d, e, f, g, h, j, and bb bars represent mean +/− standard error with n=3 biological replicates and statistical analysis by two tailed, unpaired t-test, df=4. For s-aa, lines run through the mean +/− standard error with n=3 biological replicates for each time-point and statistical analysis by ANOVA. p values are indicated in the panels.
Extended Data Figure 8. KDM4A and KDM4B overexpression suppresses elevated H3K9me3 and rescues HDR deficiency in oncometabolite producing cells, in contrast to no effect from catalytically dead mutants or from other αKG-dependent dioxygenases.

(a-b) Western blot analysis of H3K9me3 and total H3 levels in the renal cell carcinoma cell lines (a) SNU1079 (IDH1 R132C/+), (b) UOK262 (FH −/−) and (c) NCCFH1 (FH −/−) cells treated as indicated or after transfection with HA-tagged expression vectors for KDM4A, catalytically inactive KDM4A H188A, KDM4B, catalytically inactive KDM4B H189A, KDM4C, and KDM6A or FLAG tagged vectors for ALKBH2, ALKBH3 and JMJD4. (d) Quantification of RAD51 positive foci in SNU1079 cells after indicated treatment or transfection. (e-j) Quantification of (e,f) Tip60 foci positive nuclei (>10 foci per nucleus), (g,h) RAD51 foci positive nuclei, and (i,j) mean comet tail moment in UOK 262 and NCCFH1 FH −/− renal cell carcinoma cell lines, after transfection with FH expression constructs or after transfection with HA-tagged expression vectors for KDM4A, catalytically inactive KDM4A H188A, KDM4B, catalytically inactive KDM4B H189A, KDM4C, or KDM6A or FLAG tagged vectors for ALKBH2, ALKBH3 or JMJD4. In g and h, cells treated with 2 mM αKG or DMSO control are also included in the analysis. (k) Western blots showing H3K9me3 and total H3 levels after transfection of HA-tagged KDM4A or KDM4B constructs in YUNK1 shSDHB or shFH cells. (l) Quantification of neutral comet assay in immortalized astrocytes expressing WT IDH or IDH1 R132H and in YUNK1 shCTRL, shSDHB, and shFH cells, with or without overexpression of KDM4A or KDM4B, as indicated, or with 24 h treatment with 2 mM dimethyl-αKG. (m-n) Quantification of RAD51 nuclear foci 6 h after 2 Gy IR in (m) WT or IDH1R132/+ HeLa cells and (n) in HEK293FT cells with shRNA suppression of SDHB (shSDHB) or FH (shFH) as compared to non-targeting shRNA (shCTRL). Cells were irradiated after 24 h pretreatment with dimethyl-αketoglutarate (αKG) or 24 h after transfection with expression vectors for KDM4A or KDM4B. (o-p) Quantification of BRCA1 nuclear foci 4 h after 2 Gy IR in (o) WT or IDH1R132H/+ HeLa cells and (p) HEK293FT cells with shRNA suppression of SDHB (shSDHB) or FH (shFH) as compared to non-targeting shRNA (shCTRL). Cells were irradiated after 24 h pretreatment with αKG or 24 h after transfection with expression vectors for KDM4A or KDM4B. (q) Quantification of neutral comet assays performed in HIF-1α WT and knockout (KO) mouse embryonic fibroblasts (MEFs) after treatment with 500 μM octyl-(R)-2HG, 2 mM succinate, or 30 μM dimethyl-fumarate as compared to DMSO control. (r) Western blot analysis of HIF-1α after indicated treatment of WT MEFs and HIF-1α KO MEFs with 500 μM octyl-(R)-2HG, 2 mM succinate, or 30 μM dimethyl-fumarate. Hypoxia exposure at 1% Oxygen for 24 h is used as a positive control for HIF-1α stabilization. (s) Western blot analysis of KDM4A and KDM4B expression and H3K9me3 levels in KDM4A knockout and KDM4B knockout YUNK1 cell lines. (t-u) Quantification of (t) RAD51 foci positive cells at 4 h post 2 Gy IR and (u) comet tail moment in parental YUNK1 cells, YUNK1 KDM4A knockout cells, and YUNK1 KDM4B knockout cells after transfection with overexpression constructs for either the KDM4A or KDM4B, or mock transfection, as indicated. (v) Western blot analysis of KDM4A and KDM4B expression and of H3K9me3 levels in KDM4A and KDM4B knockout YUNK1 cells compared to parental YUNK1 controls after transfection of HA-tagged overexpression constructs for the KDM4A and KDM4B ORFs as indicated. For d, e, f, g, h, j, l, m, n, o, p, q, t, and u bars represent mean +/− standard error with n=3 biological replicates and statistical analysis by two tailed, unpaired t-test, df=4. p values are indicated in the panels.
Extended Data Figure 9. Inhibition of KDM4B mediates oncometabolite induced HDR deficiency.

(a) Quantification of neutral comet assay and (b) quantification of RAD51 foci positive cells (>10 foci per nucleus) at 4 h post 2 Gy IR in parental YUNK1 cells, YUNK1 KDM4A knockout cells, and YUNK1 KDM4B knockout cells after siRNA suppression of either KDM4A or KDM4B, or non-targeting siRNA control (siCTRL), as indicated. (c) Quantification of RAD51 foci positive cells and (d) quantification of neutral comet assay in YUNK1 KDM4B knockout cells transfected with expression constructs for either WT KDM4B or the catalytically inactive KDM4B H189A. (e) Quantification by ChIP of baseline H3K9me3 levels (in the absence of a DSB) at the DSB-ChIP reporter locus in U2OS cells after siRNA suppression of either KDM4A or KDM4B as compared to non-targeting control siRNA. (f) Validation of siRNA suppression of KDM4A and KDM4B and documentation of H3K9me3 levels by western blot in the U2OS DSB-ChIP cells. (g-o) Pertaining to Fig. 3g–I, line graphs of percent input values for DSB-ChIP assays performed after siRNA suppression of KDM4A or KDM4B with antibodies for (g) γH2A.X (siKDM4A F=0.0, df=1, siKDM4B F=0.02, df=1), (h) SUV39H1 (siKDM4A F=60.85, df=1, siKDM4B F=0.98, df=1), (i) H3K9me3 (siKDM4A F=1.4, df=1, siKDM4B F=28.3, df=1), (j) Tip60 (siKDM4A F=15.2, df=1, siKDM4B F=41.3, df=1), (k) MRE11 (siKDM4A F=15.5, df=1, siKDM4B F=69.3, df=1), (l) ATM (siKDM4A F=0.1, df=1, siKDM4B F=15.4, df=1), (m) BRCA1 (siKDM4A F=5.5, df=1, siKDM4B F=19.94, df=1), (n) RPA32 (siKDM4A F=1.9, df=1, siKDM4B F=24.5, df=1), and (o) RAD51(siKDM4A F=0.88, df=1, siKDM4B F=7.4, df=1) at the indicated time-points post addition of triamcinolone and Shield-1 to induce an I-SceI break in DSB-ChIP U2OS cells. (p) Quantification and representative images of neutral comet assays performed in DSB-CHIP U2OS cells after siRNA suppression of KDM4 or KDM4B compared to a non-targeting control siRNA (siCTRL). Scale bars are 400 μm. (q) Western blot analysis of IDH1 R132H expression in parental YUNK1, KDM4A knockout YUNK1 cells, and KDM4B knockout YUNK1 cells, treated with either doxycycline (DOX; to induce IDH1 R132H expression) or vehicle control, along with western blot analysis of respective global H3K9me3 and total H3 levels. (r-s) Quantification of (r) Tip60 and (s) RAD51 foci positive cells (>10 foci per nucleus) post 2 Gy IR (at 1 h for Tip60 and 4 h for RAD51) in parental YUNK1 cells, KDM4A knockout YUNK1 cells, and KDM4B knockout YUNK1 cells, treated with either doxycycline or vehicle control, and also treated as indicated with DMSO, 500 μM octyl-(R)-2HG, 1mM AGI-5198, or 500 μM octyl-(R)-2HG and 1mM AGI-5198 combined. (t) Western blot analysis of KDM4A and KDM4B levels in HT1080 cells (IDH1 R132C/WT) and in HT1080 cells with CRISPR/Cas9 knockout of the mutant IDH1 allele (IDH1 KO/WT) transfected with siSCR, siKDM4A or siKDM4B, along with western blot analysis of respective global H3K9me3 and total H3 levels. (u-v) Quantification of (u) Tip60 and (v) RAD51 foci positive cells (>10 foci per nucleus) post 2 Gy IR in HT1080 cells (IDH1 R132C/WT) and in HT1080 cells with CRISPR/Cas9 knockout of the mutant IDH1 R132C allele (IDH1 KO/WT) transfected with siSCR, siKDM4A or siKDM4B, and treated with or without 500 μM 2HG, 1 mM AGI-5198, or 1mM AGI-5198 plus 500 μM 2HG. (w) Quantification of mean comet tail moment in parental YUNK1 cells, KDM4A knockout YUNK1 cells and, KDM4B knockout YUNK1 cells treated with either 500 μM octyl-R-2HG or DMSO control. (x) Quantification of cell proliferation by serial cell counts over time of parental YUNK1 cells, KDM4A knockout cells (two independent clones), and KDM4B knockout YUNK1 cells (two independent clones). (y) Western blot analysis of KDM4A and KDM4B expression levels in U87 glioma cells with KDM4A knockout or KDM4B knockout as compared to parental U87 cells, along with western blot analysis of respective global H3K9me3 and total H3 levels. (z) Quantification of cell proliferation by serial cell counts of parental U87 cells, KDM4A knockout U87 cells (two independent clones), and KDM4B knockout U87 cells (two independent clones). (aa) Western blot analysis of expression of mutant H3 constructs and analysis of H3K9me3 levels after expression of the indicated H3 mutants in SNU1079 R132C IDH1 mutant cholangiocarcinoma cells. Note that only H3K9M can reduce global H3K9me3 levels in IDH1 mutant cells. (bb) Western blot analysis of IDH1 R132H, H3K4me3, H3K9me3, H3K27me3, H3K36me3, and total H3 in WT IDH and IDH1 R132H/WT U87 glioblastoma cells. (cc) Quantification of 2HG levels by fluorometric 2HG detection assay in SNU1079 (IDH1 R132C/+) cholangiocarcinoma cells transfected with either WT H3.3 or H3.3K9M expression constructs. For a, b, c, d, e, p, r, s, u, v, w, and cc bars represent mean +/− standard error with n=3 biological replicates and statistical analysis by two tailed, unpaired t-test, df=4. For f, h and i-q, points represent mean +/− standard error with n=3 biological replicates and statistical analysis by ANOVA, with p values as indicated.
Extended Data Figure 10. Oncometabolites induce HDR deficiency via hypermethylation of H3K9.

(a-b) Quantification of neutral comet assay performed in (a) SNU1079 (IDH1 R132C/WT) cholangiocarcinoma cells and (b) UOK262 FH−/− renal cell carcinoma cells after expression of the indicated H3.3 mutants. (c) Quantification of neutral comet assay performed in YUNK1 shSDHB, shFH, or shCTRL cells transfected with expression constructs for WT H3.3 versus H3.3 K9 to M. Cells were assayed 24 h after transfection with the indicated construct. (d) Western blot analysis of global H3K9me3 levels in YUNK1 shSDHB or shFH cells transfected with either a WT histone H3.3 expression vector or an H3.3 K9 to M mutant expression vector. (e) Western blot analysis of pATM and total ATM levels in shCTRL, shSDHB, and shFH YUNK1 cells transfected with expression constructs for WT H3.3 or an H3.3 K9 to M mutant, at 1h post IR (5 Gy) or without IR treatment. (f) Quantification over time by ChIP of H3K9me3, H3K4me3, H3K27me3 and H3K36me3 levels after induction of the site-specific DSB in U2OS DSB-ChIP cells after DMSO treatment. The H3K9me3 data is also presented in Figure 2 and Extended data figure 3 for relevant comparisons. (g) Western blot analysis of H3K9M mutant construct expression and H3K9me3 levels in U2OS DSB-ChIP cells after expression of either H3K9M or WT H3 or treatment with DMSO control or 500 μM octyl-(R)-2HG. (h) ChIP analysis of H3K9me3 occupancy at the DSB-ChIP locus in U2OS cells (in the absence of an induced DSB), after transfection with wither the WT H.3.3 expression construct or the H3.3K9M expression construct after indicated treatment with either 500 μM 2HG or DMSO control. (i-q) Pertaining to Fig. 4b–e, line graphs of percent input values for DSB-ChIP assays performed in U2OS cells after transfection with either the WT H.3.3 expression construct or the H3.3K9M expression construct and with either 500 μM 2HG or DMSO, as indicated, with antibodies for (i) H3K9me3 (F=54.63, df=1), (j) γH2A.X (F=1.95, df=1), (k) SUV39H1 (F=34.11, df=1), (l) Tip60 (F=126.6, df=1), (m) MRE11 (F=7.9, df=1), (n) ATM (F=0.75, df=1), (o) BRCA1 (F=119.5, df=1), (p) RPA32 (F=10.34, df=1), (q) RAD51 (F=80.2, df=1), and (r) Total H3 (F=120.6, df=1) at the indicated time points post addition of triamcinolone and Shield-1 to induce an I-SceI break. (s) Line graphs of percent input values for DSB-ChIP assays performed with antibodies for KDM4A and KDM4B in U2OS cells at the indicated time points post addition of triamcinolone and Shield-1 to induce an I-SceI break. (t) Quantification of neutral comet assay performed in YUNK1 shSDHB, shFH, or shCTRL cells transfected with expression constructs for WT H3.3 versus H3.3 K9 to R. Cells were assayed 24 h after transfection with the indicated construct. (u-v) quantification of (u) Tip60 foci positive nuclei (>10 foci per nucleus) at 1 h post 2 Gy IR and (v) RAD51 foci positive nuclei at 4 h post 2 Gy IR in immortalized astrocytes and YUNK1 cells transfected with expression constructs for WT H3.3 versus H3.3 K9 to R. (w) PARP inhibitor sensitivity in U87 WT IDH1 and U87 IDH1 R132H/WT glioblastoma cells transfected with expression constructs for WT H3.3, for H3.3 K9 to M or for H3.3 K9 to R. (IDH1 WT: H3.3 WT vs H3K9R F=8.7, df=1; IDH1 R132H: H3.3 WT vs H3K9M F=23.0, df=1). (x) Quantification of genomic H3K9me3 peaks across chromosomes by analysis of ChIP-seq data for H3K9me3 in a matched pair of immortalized human astrocyte cell lines expressing WT IDH1 or IDH1 R132H28. Peaks were called using HOMER (v4.10) and are defined as spanning at least 1000 base pairs and at least 2500 base pairs apart, filtered by p ≤ 0.01. n=2 technical replicates. (y) Quantitative PCR analysis of amplicons that span the Cas9/guide RNA cleavage target sites to asses I-SceI cleavage at the H3K9me3 differentially methylated, H3K9me3 both low, and H3K9me3 both high loci in WT IDH1 and IDH1 R132H/WT astrocytes. Reduced amplification of the genomic DNA across the Cas9/guide RNA target sites indicates that cleavage at the target site has occurred. (z-aa) ChIP analysis of (z) MRE11, and (aa) RPA32 at H3K9me3 differentially methylated, H3K9me3 low, and H3K9me3 high loci as identified in (x) in the IDH1 WT and IDH1 R132H mutant astrocyte cell lines at 12 h post Cas9 nucleofection. (bb-cc) Quantification of (bb) Tip60 foci positive nuclei (>10 foci per nucleus) at 1 h post 2 Gy IR and (cc) RAD51 foci positive nuclei at 4 h post 2 Gy IR in immortalized astrocytes and YUNK1 cells transfected with siRNA to knockdown SUV39H1 or non-targeting control (siCTRL). (dd) Western blot analysis of SUV39H1 levels in YUNK1 cells and immortalized astrocytes transfected with siRNA to knockdown SUV39H1 or non-targeting control (siCTRL). For f, i-s and w line through the mean +/− SEM and statistical analysis by ANOVA, with p values as indicated. For a, b, c, h, t, u, v, y, z, aa, bb, and cc bars represent mean +/− standard error with n=3 biological replicates and statistical analysis by two tailed, unpaired t-test, df=4. P values are indicated in the panels.
Supplementary Material
Acknowledgements.
We thank Denise Hegan and Amrit Dhawan for their assistance. This work was supported by the NIH (grants R01ES005775 and R35CA197574 to P.M.G., and R01CA215453 to R.S.B.) and by the American Cancer Society (Research Scholar Grant to R.S.B.). P.L.S. was supported by the NIH National Institute of General Medical Sciences training grant T32GM007223.
Footnotes
Competing interests. R.S.B., P.M.G., and P.L.S. are inventors on the U.S. patent application no. 62/344,678 submitted by and assigned to Yale University, which covers compositions and methods for targeting and treating HDR-deficient tumors. P.M.G and R.S.B are founders and consultants for Cybrexa Therapeutics. P.M.G. is a consultant for pHLIP Inc. Neither company has any conceptual or financial connection to this manuscript.
Data Availability. All data generated or analyzed during this study are included in this published article (and its supplementary information files, including source data). There are no restrictions on data availability.
References.
- 1.Hanahan D & Weinberg RA Hallmarks of cancer: the next generation. Cell 144, 646–674, (2011). [DOI] [PubMed] [Google Scholar]
- 2.Dang L et al. Cancer-associated IDH1 mutations produce 2-hydroxyglutarate. Nature 462, 739–744 (2009). [DOI] [PMC free article] [PubMed] [Google Scholar]
- 3.Toro JR et al. Mutations in the fumarate hydratase gene cause hereditary leiomyomatosis and renal cell cancer in families in North America. Am. J. Hum. Genet 73, 95–106 (2003). [DOI] [PMC free article] [PubMed] [Google Scholar]
- 4.Pollard P et al. Accumulation of Krebs cycle intermediates and over-expression of HIF1α in tumours which result from germline FH and SDH mutations. Hum. Mol. Gen 14, 2231–2239 (2005). [DOI] [PubMed] [Google Scholar]
- 5.Sulkowski PL et al. 2-Hydroxyglutarate produced by neomorphic IDH mutations suppresses homologous recombination and induces PARP inhibitor sensitivity. Sci. Transl. Med 9, eaal2463, doi: 10.1126/scitranslmed.aal2463 (2017). [DOI] [PMC free article] [PubMed] [Google Scholar]
- 6.Sulkowski PL et al. Krebs-cycle-deficient hereditary cancer syndromes are defined by defects in homologous-recombination DNA repair. Nat Genet 50, 1086–1092 (2018). [DOI] [PMC free article] [PubMed] [Google Scholar]
- 7.Xu W et al. Oncometabolite 2-hydroxyglutarate is a competitive inhibitor of α-ketoglutarate-dependent dioxygenases. Cancer Cell 19, 17–30 (2011). [DOI] [PMC free article] [PubMed] [Google Scholar]
- 8.Xiao M et al. Inhibition of α-KG-dependent histone and DNA demethylases by fumarate and succinate that are accumulated in mutations of FH and SDH tumor suppressors. Genes Dev 26, 1326–1338 (2012). [DOI] [PMC free article] [PubMed] [Google Scholar]
- 9.Turcan S et al. IDH1 mutation is sufficient to establish the glioma hypermethylator phenotype. Nature 483, 479–483 (2012). [DOI] [PMC free article] [PubMed] [Google Scholar]
- 10.Lu C et al. IDH mutation impairs histone demethylation and results in a block to cell differentiation. Nature 483, 474–478 (2012). [DOI] [PMC free article] [PubMed] [Google Scholar]
- 11.Losman JA & Kaelin WG Jr. What a difference a hydroxyl makes: mutant IDH, (R)-2-hydroxyglutarate, and cancer. Genes Dev 27, 836–852 (2013). [DOI] [PMC free article] [PubMed] [Google Scholar]
- 12.Whetstine JR et al. Reversal of histone lysine trimethylation by the JMJD2 family of histone demethylases. Cell 125, 467–481 (2006). [DOI] [PubMed] [Google Scholar]
- 13.Polo SE & Jackson SP Dynamics of DNA damage response proteins at DNA breaks: a focus on protein modifications. Genes Dev 25, 409–433 (2011). [DOI] [PMC free article] [PubMed] [Google Scholar]
- 14.Pierce AJ, Johnson RD, Thompson LH & Jasin M XRCC3 promotes homology-directed repair of DNA damage in mammalian cells. Genes Dev 13, 2633–2638 (1999). [DOI] [PMC free article] [PubMed] [Google Scholar]
- 15.Bindra RS, Goglia AG, Jasin M & Powell SN Development of an assay to measure mutagenic non-homologous end-joining repair activity in mammalian cells. Nucleic Acids Res 41, e115, doi: 10.1093/nar/gkt255 (2013). [DOI] [PMC free article] [PubMed] [Google Scholar]
- 16.Zhou Y, Caron P, Legube G & Paull TT Quantitation of DNA double-strand break resection intermediates in human cells. Nucleic Acids Res 42, e19, doi: 10.1093/nar/gkt1309 (2014). [DOI] [PMC free article] [PubMed] [Google Scholar]
- 17.Ayrapetov MK, Gursoy-Yuzugullu O, Xu C, Xu Y & Price BD DNA double-strand breaks promote methylation of histone H3 on lysine 9 and transient formation of repressive chromatin. Proc. Natl Acad. Sci. USA 111, 9169–9174 (2014). [DOI] [PMC free article] [PubMed] [Google Scholar]
- 18.Sun Y et al. Histone H3 methylation links DNA damage detection to activation of the tumour suppressor Tip60. Nat. Cell. Biol 11, 1376–1382 (2009). [DOI] [PMC free article] [PubMed] [Google Scholar]
- 19.Williamson EA, Wray JW, Bansal P & Hromas R Overview for the histone codes for DNA repair. Prog. Mol. Biol. Transl 110, 207–227 (2012). [DOI] [PMC free article] [PubMed] [Google Scholar]
- 20.Ikura T et al. Involvement of the TIP60 histone acetylase complex in DNA repair and apoptosis. Cell 102, 463–473 (2000). [DOI] [PubMed] [Google Scholar]
- 21.Black JC et al. KDM4A lysine demethylase induces site-specific copy gain and rereplication of regions amplified in tumors. Cell 154, 541–555, (2013). [DOI] [PMC free article] [PubMed] [Google Scholar]
- 22.Young LC, McDonald DW & Hendzel MJ Kdm4b histone demethylase is a DNA damage response protein and confers a survival advantage following γ-irradiation. J. Biol. Chem 288, 21376–21388 (2013). [DOI] [PMC free article] [PubMed] [Google Scholar]
- 23.Wang P et al. Oncometabolite D-2-hydroxyglutarate inhibits ALKBH DNA repair enzymes and sensitizes IDH mutant cells to alkylating agents. Cell reports 13, 2353–2361 (2015). [DOI] [PMC free article] [PubMed] [Google Scholar]
- 24.Pedersen MT et al. Continual removal of H3K9 promoter methylation by Jmjd2 demethylases is vital for ESC self-renewal and early development. EMBO J 35, 1550–1564 (2016). [DOI] [PMC free article] [PubMed] [Google Scholar]
- 25.Xu Y et al. Targeted disruption of ATM leads to growth retardation, chromosomal fragmentation during meiosis, immune defects, and thymic lymphoma. Genes Dev 10, 2411–2422 (1996). [DOI] [PubMed] [Google Scholar]
- 26.Shan C-M et al. A histone H3K9M mutation traps histone methyltransferase Clr4 to prevent heterochromatin spreading. Elife 5, e17903 (2016). [DOI] [PMC free article] [PubMed] [Google Scholar]
- 27.Mallette FA et al. RNF8‐and RNF168‐dependent degradation of KDM4A/JMJD2A triggers 53BP1 recruitment to DNA damage sites. EMBO J 31, 1865–1878 (2012). [DOI] [PMC free article] [PubMed] [Google Scholar]
- 28.Turcan S et al. Mutant-IDH1-dependent chromatin state reprogramming, reversibility, and persistence. Nat Genet 50, 62–72 (2018). [DOI] [PMC free article] [PubMed] [Google Scholar]
Associated Data
This section collects any data citations, data availability statements, or supplementary materials included in this article.