


Figure 1: Pre-treatment molecular profiles of tumor biopsies and cfDNA from long-term responders to PD-(L)1 blockade.
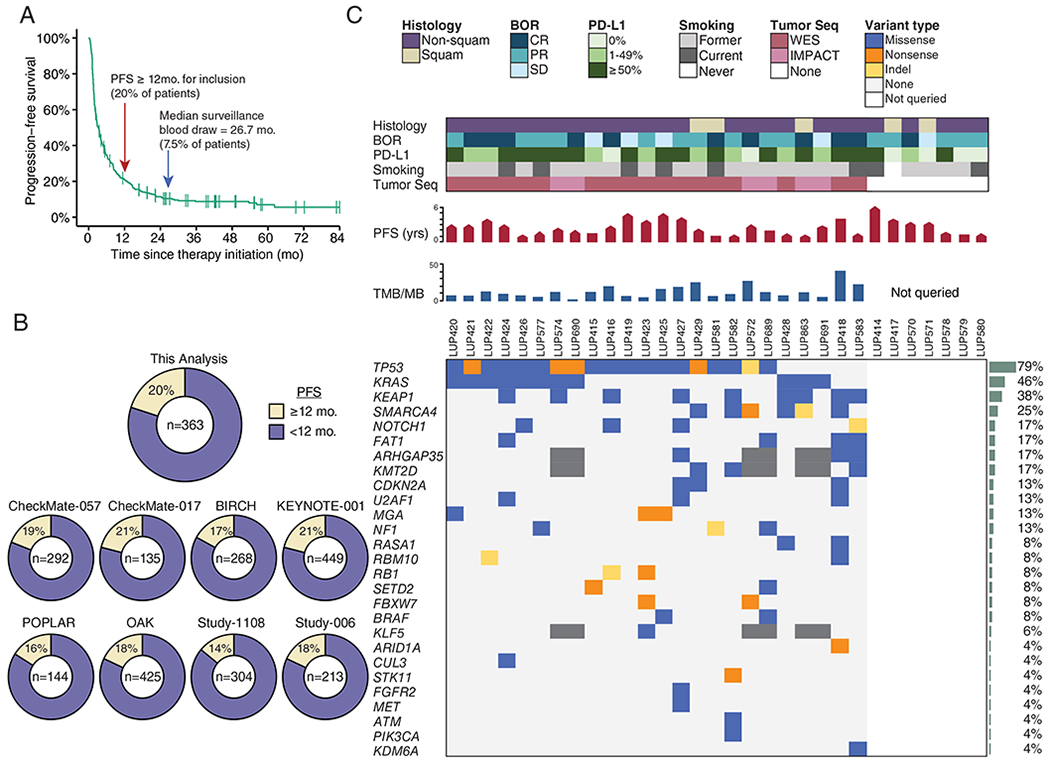
A) Progression-free survival of patients with NSCLC treated with PD-(L)1 blockade as part of initial clinical trials at MSKCC (n = 363). Arrows indicate cut-off for definition of long-term benefit (PFS ≥ 12 months), and the median surveillance plasma collection time (26.7 months).
B) Percent of patients who would be classified as achieving long-term benefit from (A) as well as, for context, other clinical trials with unselected NSCLC.
C) Clinical and molecular features of patients with advanced NSCLC experiencing long-term responses to PD-(L)1 blockade. Each column represents an individual patient. Boxes are color coded for tumor histology (squamous or non-squamous), smoking status (former, current, or never), and best overall response (BOR) by RECIST criteria (complete response [CR], partial response [PR], or stable disease [SD]) as indicated. Tumor PD-L1 expression is stratified as 0%, 1%-49%, or ≥50%. When available, pre-treatment tumor tissue was sequenced (Tumor Seq) by whole exome sequencing (WES) or a targeted panel (MSK-IMPACT). Patients with no Tumor Seq were unevaluable for TMB and individual tumor mutations as depicted on the right. PFS is depicted in months, where the pointed bars represent ongoing responses and the flat bars represent patients who have progressed. TMB is presented as the number of nonsynonymous mutations and indels per megabase of the coding exome. Nonsynonymous mutations and indels in genes recurrently mutated in NSCLC are shown in descending order of prevalence (35). Mutation recurrence rate in the cohort is depicted by bar graphs to the right.