


Figure 4. Thalamocortical and corticocortical interactions showed pathway-specific NCC.
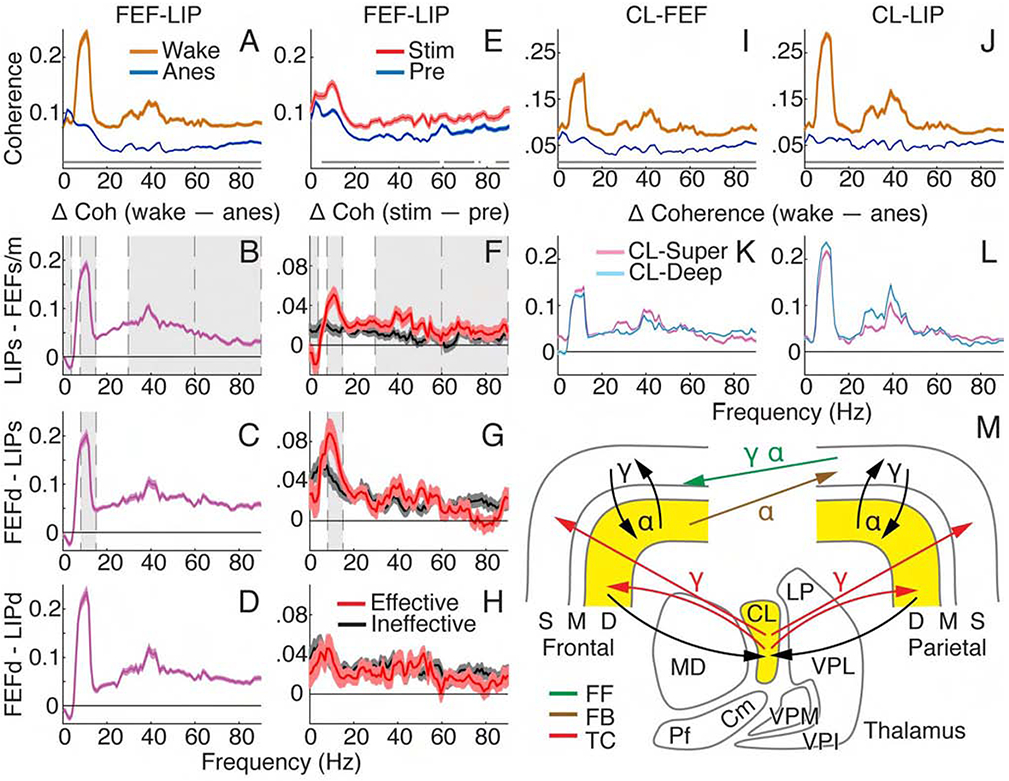
(A) Population coherence with 95% confidence intervals for all paired contacts between FEF and LIP during wakefulness and anesthesia. Gray lines show significant differences between spectra (Holm’s-corrected T-tests). (B-D) Population average coherence difference: wake – anesthesia. Error bars indicate 95% confidence intervals of T-tests at each frequency. Gray shading shows effects consistent between state and thalamic stimulation (in F-H) results. (B) Superficial LIP and superficial/mid FEF; (C) deep FEF and superficial LIP; (D) deep FEF and deep LIP. (E) Population coherence between FEF and LIP with 95% confidence intervals for all paired contacts under anesthesia, before and during effective stimulation. (F-H) Population average coherence difference, stim – pre, with 95% confidence intervals for effective and ineffective stimulations. (F) Superficial LIP and superficial/mid FEF; (G) deep FEF and superficial LIP; (H) deep FEF and deep LIP. (I and K) Population thalamocortical coherence with 95% confidence intervals for wake and anesthesia across all paired CLFEF (I) and CL-LIP (J) contacts. (K and L) Population average thalamocortical coherence difference, wake – anesthesia, with 95% confidence intervals of T-tests. CL-superficial and CL-deep layers for (K) FEF and (L) LIP. (M) Schematic showing pathways and predominant frequencies contributing to NCC. Yellow shading where spiking changes with consciousness level. FF, feedforward; FB, feedback; TC, thalamocortical.