


Figure 4.
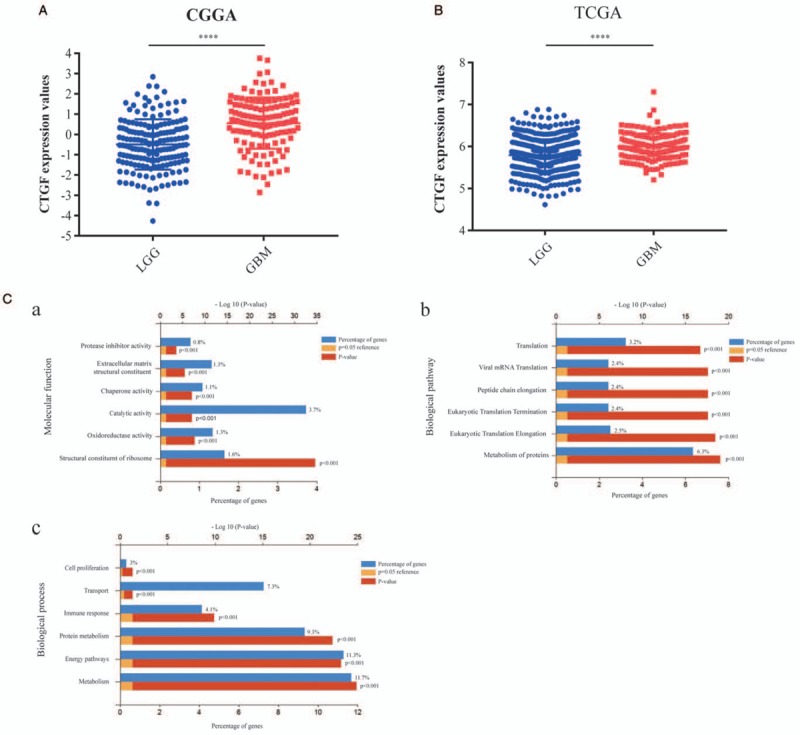
Higher expression and Go analysis of CTGF in GBM. (A) Comparison of CTGF expression values of LGG patients (n = 173) and GBM patients (n = 128) in CGGA databases (t = 7.91, P < 0.0001). (B) Comparison of CTGF expression values of LGG patients (n = 511) and GBM patients (n = 156) in TCGA databases (t = 6.106, P < 0.0001). (C) Dug differentially expressed genes (DEGs) with CTGF high expression in GBM were analyzed by GO functional enrichment analysis (first six bars, P < 0.001). (a) Molecular function for CTGF; (b) biological pathway for CTGF; (c) biological process for CTGF. CGGA: Chinese Glioma Genome Atlas; CTGF: Connective tissue growth factor; GBM: Glioblastoma; GO: Gene ontology; LGG: Lowly proliferative glioma; TCGA: The Cancer Genome Atlas.