


Fig. 2.
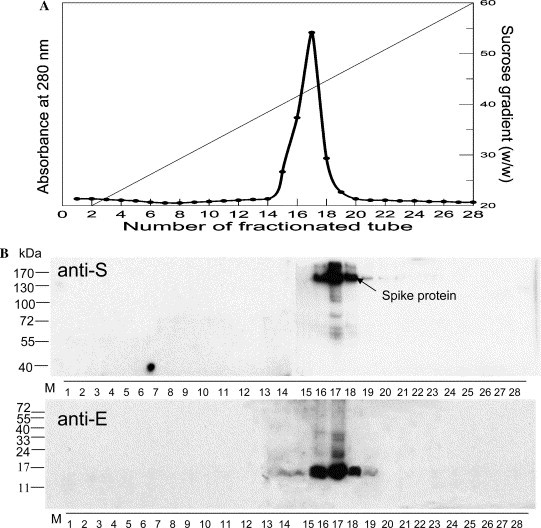
Isolation and identification of VLPs. The VLPs were isolated from cells co-expressing S, E, and M proteins. After sucrose gradient centrifugation, 28 fractions were collected and their chromatograph was shown in (A). Fractionation was monitored with a wavelength of 280 nm; the dotted line represents weight percentage of sucrose. (B) Equal amounts of gradient fractions were separately resolved in 8% (anti-S) and 14% (anti-E) of polyacrylamide gels, followed by Western analyses. Numbers on the left sides of the sub-panels are the molecular weights of protein markers (M). Western analysis confirmed the presence of S and E proteins mainly in fractions 16–18.