


Extended Data Figure 6 |. Attenuation of cortical patterning in ASD.
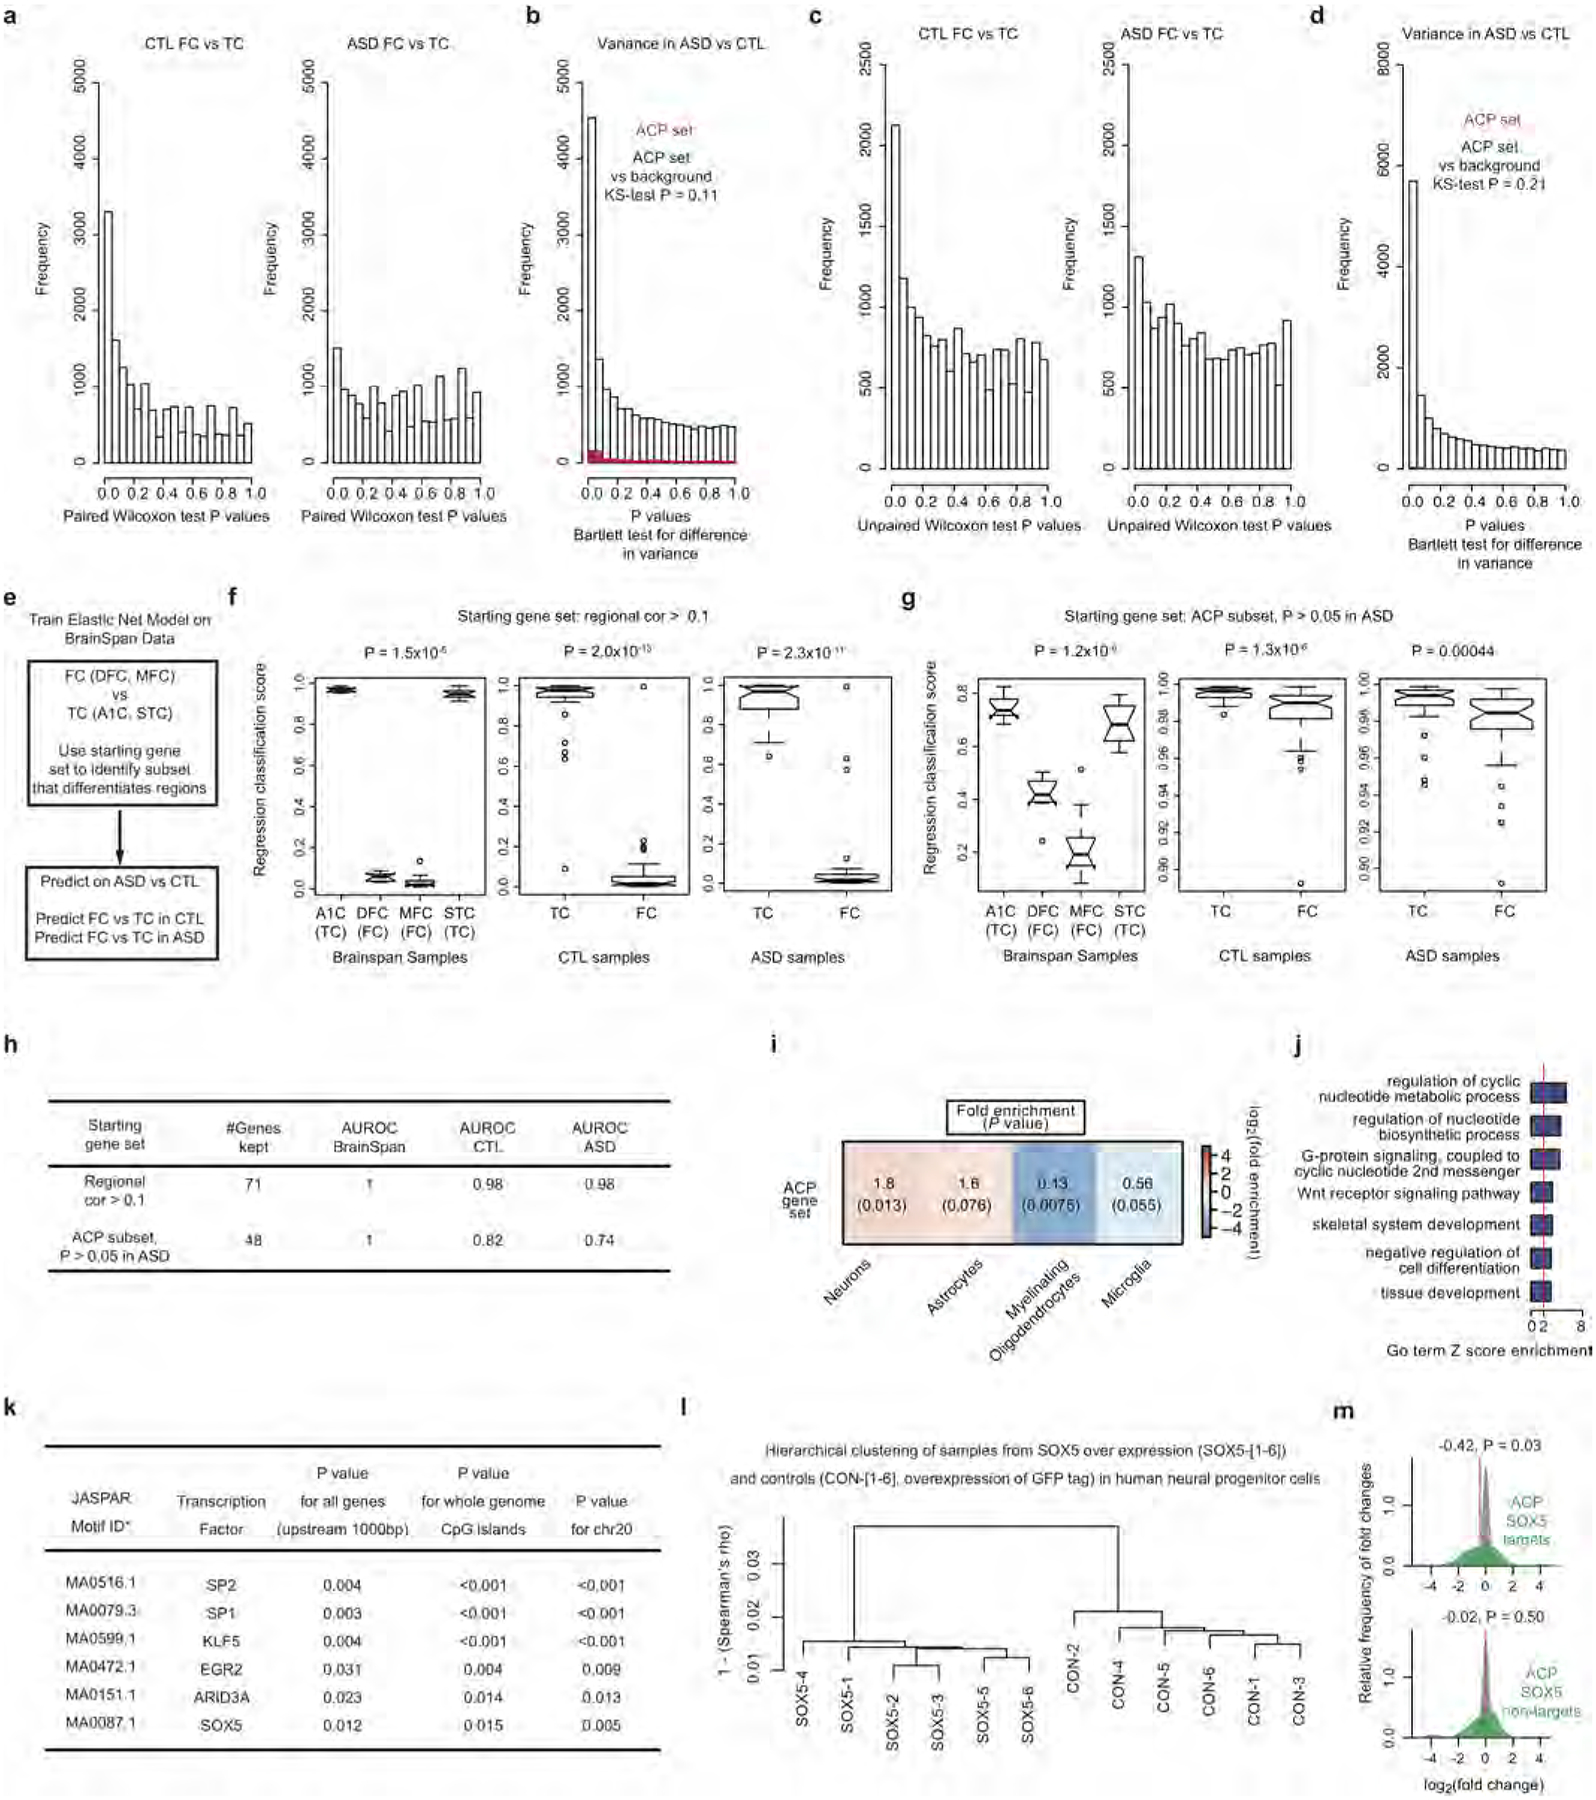
a, Histograms of P values from paired Wilcoxon rank-sum test differential gene expression between 16 frontal cortex (FC) and 16 temporal cortex (TC) samples from control and ASD individuals. b, Histogram of Bartlett’s test P values for differences in gene expression variance between ASD and control samples for all genes (white) and genes in the ACP set (red). The Kolmogorov–Smirnov (K–S) test P value for a difference between these two distributions is shown. c, Histograms of P values from unpaired Wilcoxon rank-sum test DGE between 21 frontal cortex and 22 temporal cortex samples after removing those used in ref. 8. d, Histogram of Bartlett’s test P values for differences in gene expression variance between ASD and control samples for all genes (white) and genes in the ACP set (red). The Kolmogorov–Smirnov test P value for a difference between these two distributions is reported. e, Approach to training the elastic net model on BrainSpan49,50 frontal cortex and temporal cortex samples and application of the model to 123 cortical samples in this study. f–h, Results of learned cortical region classifications with different starting gene sets, with the BrainSpan training set (left), control samples (middle) and ASD samples (right) in each panel and the Wilcoxon rank-sum test P value of frontal versus temporal cortex difference for each comparison. A1C, primary auditory cortex; DFC, dorsolateral prefrontal cortex; MFC, medial prefrontal cortex; STC, superior temporal cortex. i, Cell-type enrichment analysis for genes in the ACP set. j, GO term enrichment analysis of the ACP set. Enrichment P values are computed as described in Methods. k, Enrichment statistics for transcription factor motifs found to be significantly enriched in the ACP set (see Supplementary Information for details of P value computation). l, Average linkage hierarchical clustering of the global gene expression profiles for samples with overexpression of SOX5 and green fluorescent protein (GFP) tag overexpression (controls). m, Density plots of fold changes for the subset of ACP genes that are predicted SOX5 targets (top, green) and non-targets (bottom, green) against background (grey). The median log2[fold change] is marked (red line) and P values are from a one-sided Wilcoxon rank-sum test.