


Fig. 3. Immune stimulatory and sustained antigen presentation on DCs.
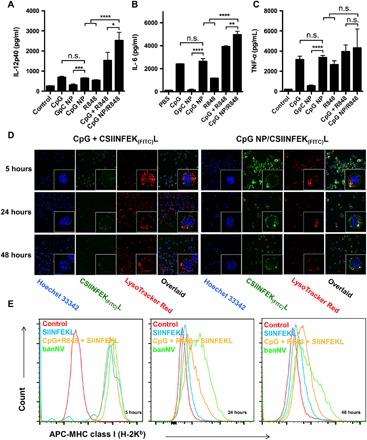
ELISA results of IL-12p40 (A), IL-6 (B), and TNF-α (C) secretion from DC2.4 cells after banNVs treatment (CpG: 200 nM; R848: 500 nM). (D) Confocal microscopy images of CSIINFEK(FITC)L presentation by DC2.4 cells after treatment with banNVs for 5, 24, and 48 hours (CpG: 200 nM and CSIINFEK(FITC)L: 2 μM). (E) Flow cytometric analysis of SIINFEKL/H-2Kb complex expression on DC2.4 cells after pretreatment with banNVs for 5, 24, and 48 hours (CpG: 200 nM and CSIINFEK(FITC)L: 2 μM). Data are represented as means ± SEM (n = 3). *P < 0.05, **P < 0.01, ***P < 0.001, and ****P < 0.0001 (Student’s t test). n.s., not significant. The definitions of the abbreviations are listed in table S2.