


Figure 3. Calculated solvation energy maps for TDP-43 fibrils based on atomic solvation parameters.
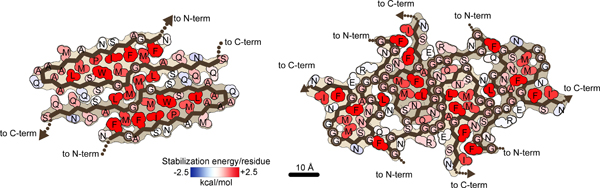
Solvation energy maps of SegA-sym (left) and SegB A315E (right). Residues are colored from unfavorable (blue, −2.5 kcal/mol) to favorable stabilization energy (red, 2.5 kcal/mol). Notice that both the dagger-shaped fold (SegA-sym) and the R-shaped fold (SegB A315E) show stable cores.