


Figure 2.
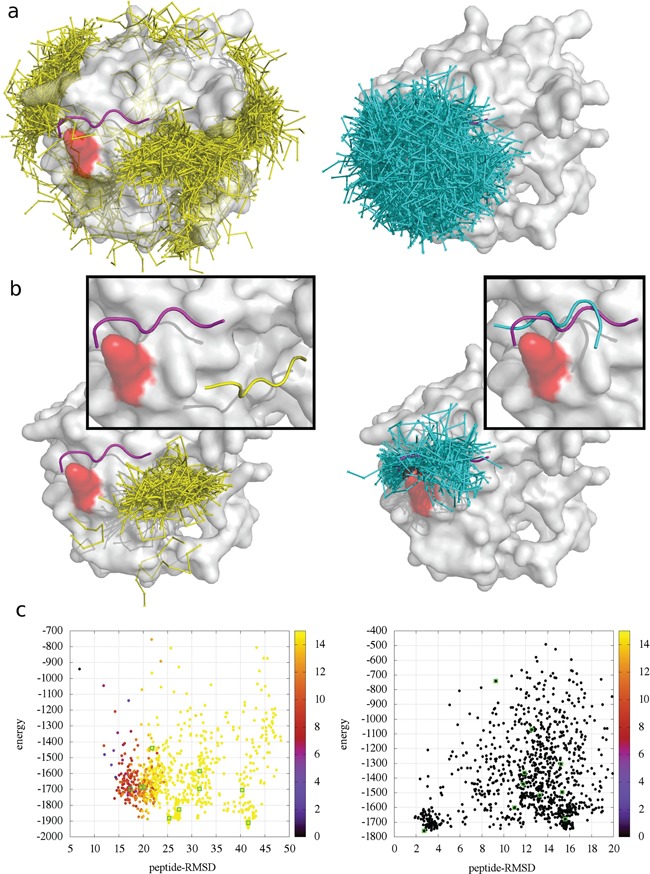
Comparison of CABS-dock docking without contact information (left panel) and with contact information (right panel) for the 1LVM case. The protein residue involved in the contact information, which has been used in docking, is marked in red. (a) 1000 top-scored models, (b) the best cluster together with the top-scored model in the close-up frame and (c) CABS-dock energy versus peptide-RMSD plot, where color of the dots denotes distance (in Angstroms) of the residues used in the contact information above the default cut-off of 5 Å (black color indicates that the distance between the residues is within the cutoff). Visualizations (a) and (b) show experimental conformation of the peptide (magenta), models from docking without contact information (yellow), models from information-driven docking (cyan) and the receptor surface (white).